. 2011 Apr 1;145(1):39-53.
doi: 10.1016/j.cell.2011.02.022. Epub 2011 Mar 3.

Drug tolerance in replicating mycobacteria mediated by a macrophage-induced efflux mechanism

Affiliations

Drug tolerance in replicating mycobacteria mediated by a macrophage-induced efflux mechanism

Kristin N Adams et al. Cell. .

Erratum in

  • Cell. 2011 Apr 1;145(1):159

Abstract

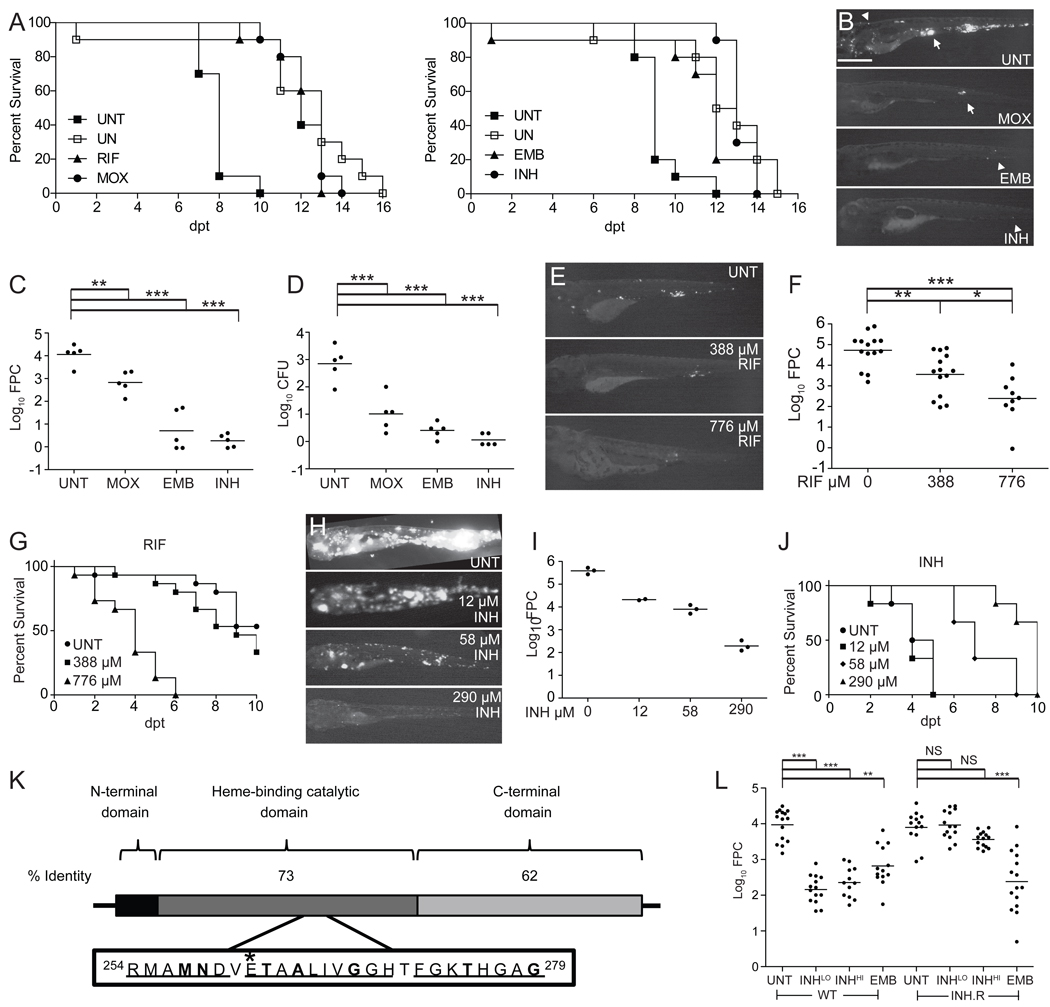
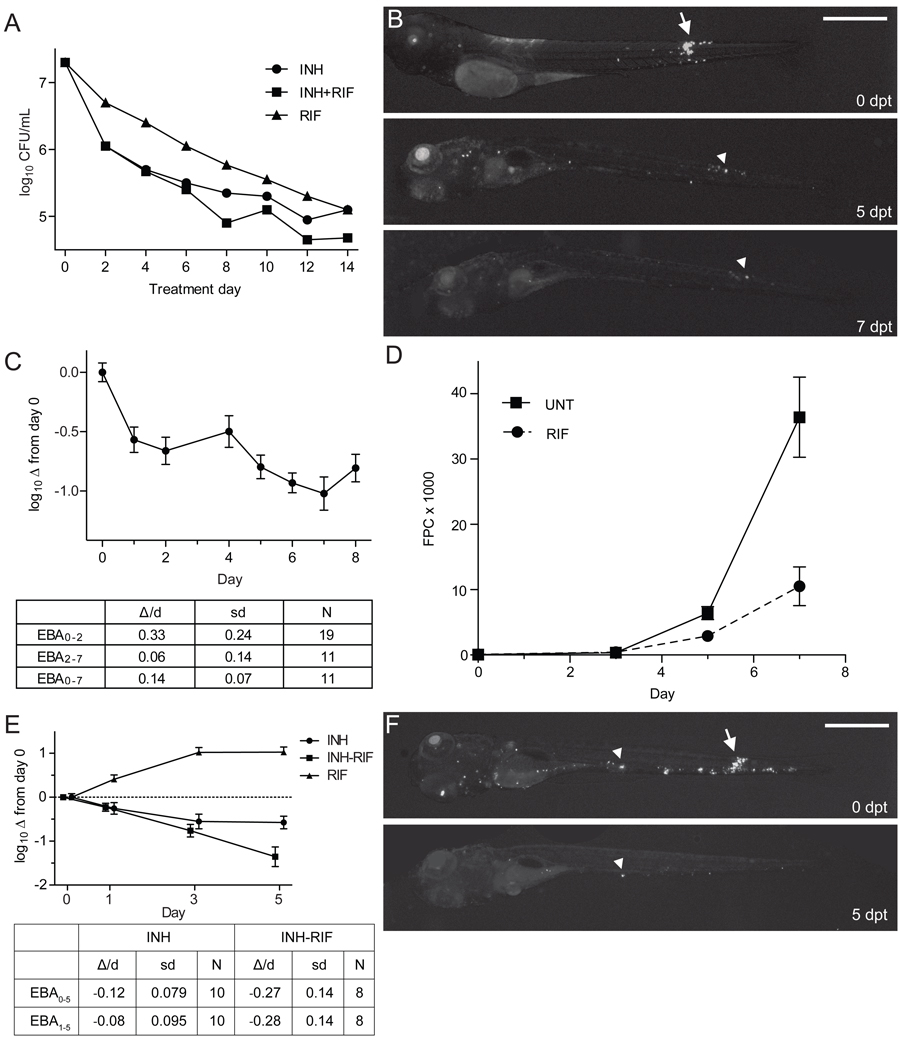
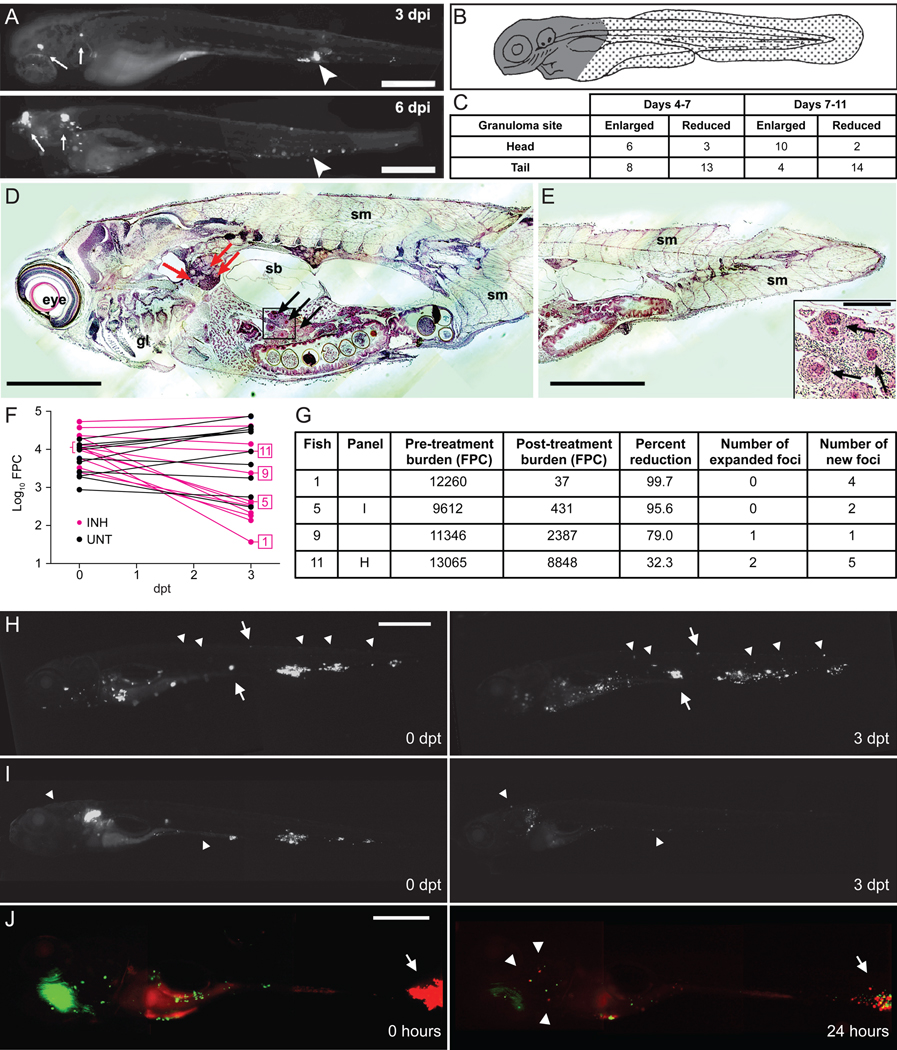
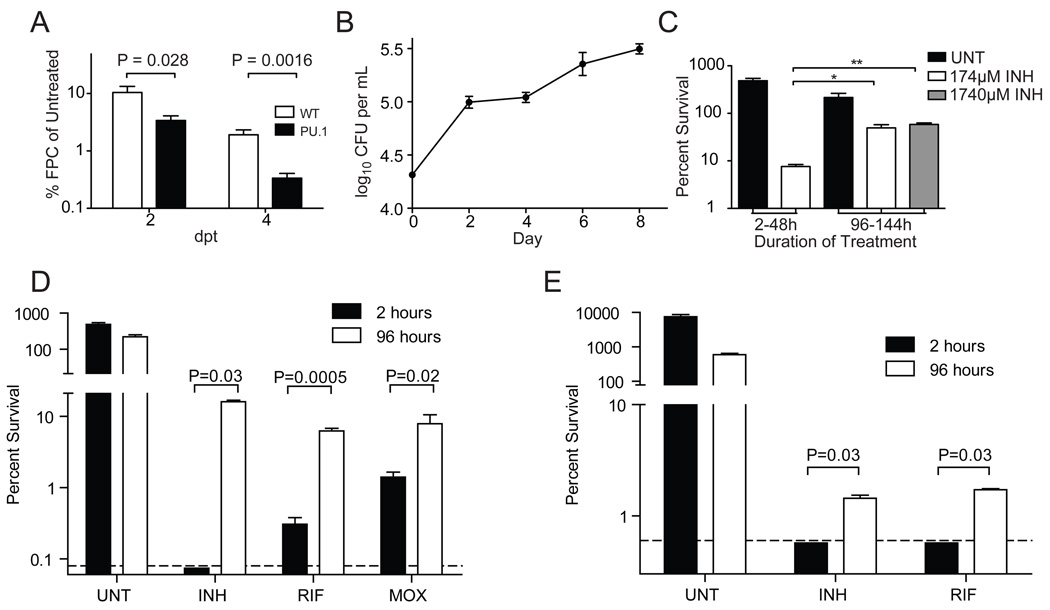
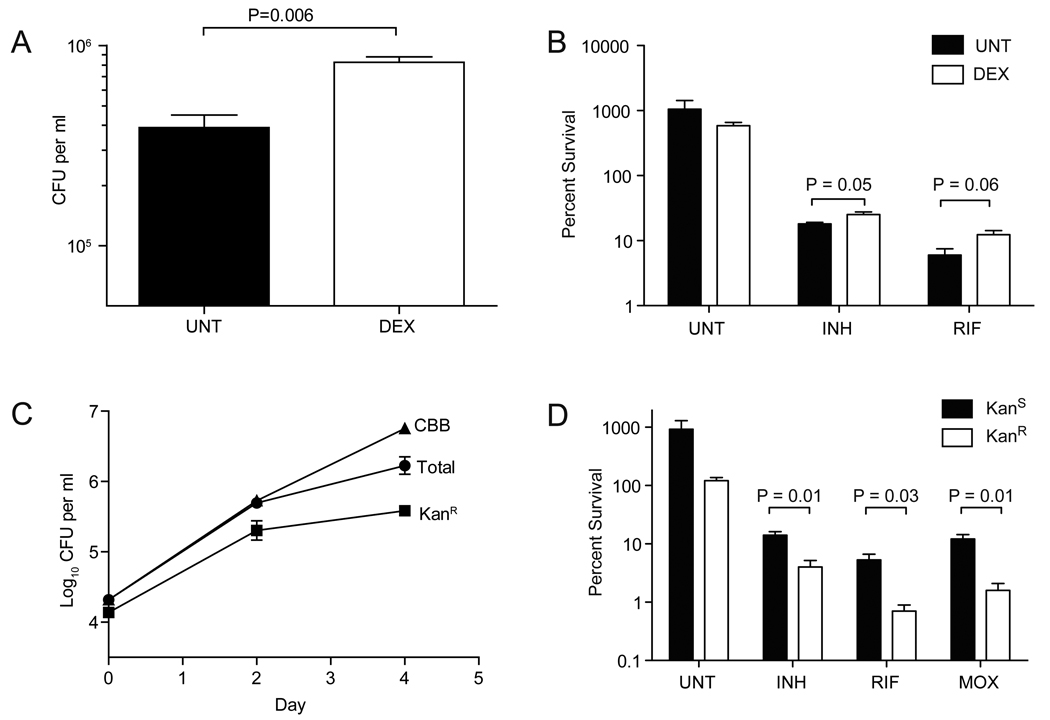
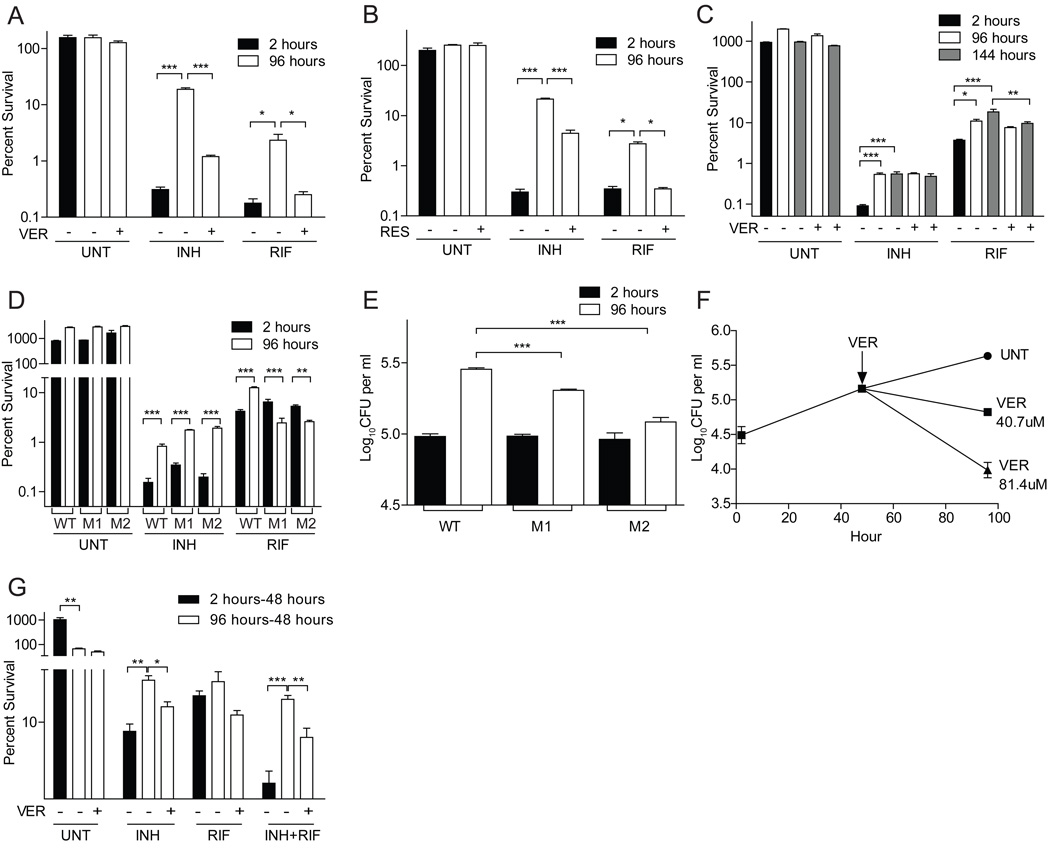
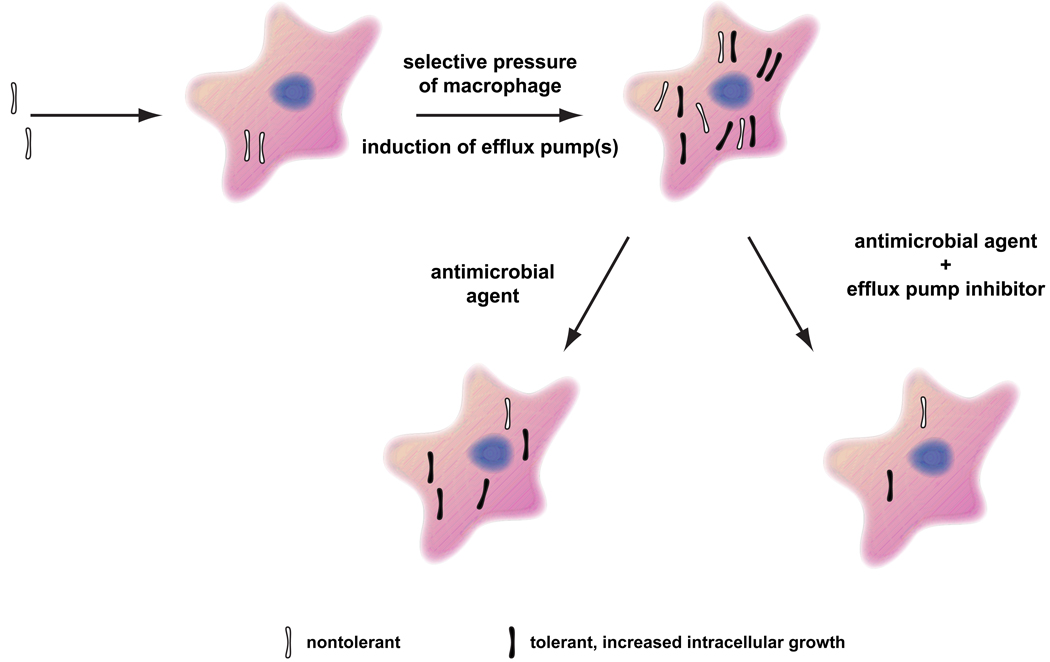
Treatment of tuberculosis, a complex granulomatous disease, requires long-term multidrug therapy to overcome tolerance, an epigenetic drug resistance that is widely attributed to nonreplicating bacterial subpopulations. Here, we deploy Mycobacterium marinum-infected zebrafish larvae for in vivo characterization of antitubercular drug activity and tolerance. We describe the existence of multidrug-tolerant organisms that arise within days of infection, are enriched in the replicating intracellular population, and are amplified and disseminated by the tuberculous granuloma. Bacterial efflux pumps that are required for intracellular growth mediate this macrophage-induced tolerance. This tolerant population also develops when Mycobacterium tuberculosis infects cultured macrophages, suggesting that it contributes to the burden of drug tolerance in human tuberculosis. Efflux pump inhibitors like verapamil reduce this tolerance. Thus, the addition of this currently approved drug or more specific efflux pump inhibitors to standard antitubercular therapy should shorten the duration of curative treatment.


Figures

Figure 1
Figure 1. The Mm-larval zebrafish infection model replicates the specificity and activity of clinically relevant antitubercular drugs
(A–D) Larvae were soaked in the MEC of RIF (388 µM), MOX (62.3 µM), EMB (1442 µM) or INH (290 µM) (Table S1). (A) Survival of uninfected (UN) larvae vs. those infected with 800 Mm and immediately treated with RIF, MOX, EMB, INH or left untreated (UNT). Left panel in the presence of 1% DMSO (see Figure S2A). Survival of treated infected larvae was significantly different from UNT larvae for all drugs (Table S2). Results are representative of at least two independent experiments. (B–D) Larvae were infected with 155 Mm and left untreated (UNT) or treated with MOX, EMB, or INH for 4 days, prior to assessment of bacterial burdens by fluorescence microscopy (B, representative larvae are shown), FPC (C) or CFU enumeration of the lysed larvae immediately after imaging (D). Arrow, granuloma; arrowhead, single infected macrophage. Scale bar 500 µm. For C and D, individual larvae (points) and means (bars) are shown. Significance testing by one way ANOVA with Dunnett’s post test. (E and F) Larvae infected with 46 Mm were soaked for 3 days in 388 or 776 µM RIF or left untreated. Representative fluorescence images (E) and bacterial burdens (F) of survivors are shown. Significance testing by one-way ANOVA with Tukey’s post-test. (G) Survival of uninfected larvae upon treatment with 0, 388 or 776 µM RIF added 2 dpf. P=0.0010 for 0 vs. 776; 0 vs. 388 µM, NS by Log-rank test. N=15 per group. (H–J) Larvae infected with 1800 Mm were left untreated or immediately soaked in 12, 58 or 290 µM INH. Representative fluorescence images (H) and bacterial burdens (I) of survivors at 4 dpt are shown. Mean ba cterial burdens (bars) compared by one-way ANOVA with Tukey’s post-test resulted in P < 0.001 for all comparisons, with the exception of 12 vs. 58 µM INH, which was not significant (P > 0.05). (J) Survival curve, N= 6 larvae per group. P=0.0018, Log-rank test for trend comparing all curves and P=0.0010 for comparison of untreated vs. 58 µM or untreated vs. 290 µM. (K) Functional domains of KatG. Mtb KatG is 740aa and Mm KatG is 743aa. Boxed inset of Mtb catalytic domain shows regions of identity with Mm (underlined) and point mutations (in bold) that confer INH resistance in Mtb (Sandgren et al., 2009). *Position of the single amino acid substitution (E265V) in the INH-resistant Mm strain corresponds to the E261 position of Mtb KatG. (L) Bacterial burdens of 3 dpt larvae infected with 300 WT or INH-resistant (INH.R) Mm and soaked in 290 (LO) or 2320 µM (HI) INH, 1442 µM EMB, or left untreated (UNT) beginning 1 dpi. Median log10FPC (bars) compared using Kruskal-Wallis test with Dunn's post-test. For all panels, *, P<0.05; **, P<0.01; ***, P<0.001, NS, not significant.
Figure 2
Figure 2. INH treatment of Mm-infected larvae results in a biphasic EBA with persistence of tolerant organisms
(A) Authors’ rendition of human clinical EBA data (see Figure 1 of (Jindani et al., 2003)) showing the rate of clearance of Mtb from sputum in patients with previously untreated, smear-positive pulmonary tuberculosis, upon treatment with INH and/or RIF. (B and C) Twenty larvae were infected with 300 Mm and treated with 290 µM INH beginning 3 dpi. Each larva was imaged daily for 8 dpt, and bacterial burdens quantified by FPC. (B) Representative larva imaged at the beginning of treatment (0 dpt), and again at five and seven dpt. Arrow, granuloma, arrowhead, macrophage containing persistent bacteria. (C) EBA curve for INH-treated larvae, showing the mean log10 FPC change from day 0. Error bars represent SEM. EBA was calculated as described in the Experimental Procedures. (D–F) Ten larvae per group were infected with 300 Mm and were serially imaged for enumeration of bacterial burden by FPC. (D) Larvae were treated with 388 µM RIF or left untreated, beginning 1 dpi. Mean FPC and SEM are shown. (E) Larvae were treated with 290 µM INH, 388 µM RIF, or a combination of both drugs beginning at 3 dpi. Data analyzed as in (C). (F) Representative INH-RIF treated larvae annotated as in (B).
Figure 3
Figure 3. Mm infections are dynamic during antibiotic treatment
(A–D) Tracking of untreated Mm infections in individual larvae. (A) Fluorescence images of a representative larva at 3 and 6 dpi. Arrows, enlarging granulomas, arrowheads, shrinking granulomas. Scale bar, 400 µm. (B) Cartoon indicating "head" region (gray) primarily containing organs, and "tail" region (stippled) comprised mostly of muscle. (C) Enumeration of expanding and contracting granulomas over time. Differential region-specific outcomes of granulomas were statistically significant for changes occurring between days 7 and 11 (P=0.0022), but not for changes occurring between days 4 and 7 (P=0.2360, Fisher’s exact test). (D and E) Hematoxylin and eosin staining showing Mm in caseating granulomas in a 33 day-old fish that was infected at 1 dpf. Red and black arrows indicate granulomas in pronephros and liver, respectively. gl, gill; sb, swim bladder; sm, somite. Scale bar 300 µm. Higher ma gnification of granulomas in boxed inset of (D) is shown on bottom right of (E). Scale bar 50 µm. (F–I) Larvae infected with varying Mm inocula for 4 days were then treated with 290 µM INH or left untreated for an additional 3 days. Larvae were imaged at 4 and 7 dpi (0 and 3 dpt). (F) Pre- and post-treatment log10 FPC values for individual larvae are plotted with data points from the same individual connected. (G) Raw FPC values before and after treatment, percent change, and the presence of expanding and new foci are reported for representative fish indicated in (F). (H and I) Fluorescence images of fish 11 (H) and fish 5 (I) as reported in (F and G), shown before and after treatment. Arrows, enlarging granulomas, and arrowheads, new foci. Scale bars 500 µm. (J) A single larva was infected with 500 Mm constitutively expressing the Kaede photoactivatible GFP for 4 days. Composite red and green fluorescence images immediately after photoactivation of a granuloma (left panel) and 24 hours later (right panel). Arrows, photoactivated granuloma, arrowheads, single macrophages containing red fluorescent bacteria. Scale bar 250 µm.
Figure 4
Figure 4. Antibiotic tolerance is induced by macrophage residence
A) Wild-type and PU.1-morphant larvae were infected with 300 Mm. One dpi, larvae were treated with 290 µM INH, or left untreated. Larvae were imaged at two and four dpt and bacterial burdens determined by FPC. For each timepoint, FPC of each treated larva was normalized to the mean FPC of the untreated control group. N=20 wild-type or 12 PU.1 morphant larvae per group. P values determined using Student’s t-test. (B and C) J774A.1 macrophages we re infected with Mm and were left untreated, or were treated with INH prior to lysis and enumeration of CFU. (B) Growth of Mm in the untreated control wells. (C) Survival of intracellular Mm upon exposure to 174 or 1740 µM INH during the time periods indicated (two-48 hours, or 96–144 hours) prior to macrophage lysis and enumeration of CFU. Percent survival was compared using one-way ANOVA with Dunnett’s post-test. (D) Mm were used to infect THP-1 macrophages for 2 or 96 hours prior to being released by macrophage lysis. CFU were enumerated at the time of release, and again following 48 hours exposure to 174 µM INH, 1.21 µM RIF, 7.48 µM MOX, or left untreated. For the purpose of display, values below the limit of detection (0.08%, dashed line) were arbitrarily set to 0.074%. P values were determined using Student’s t-test (RIF and MOX), or the Mann-Whitney rank test (INH). (E) Mtb strain H37Rv was used to infect J774A.1 macrophages, and were grown and treated as described for (D), except that the concentration of INH was 4.4 µM, reflecting the greater inherent susceptibility of this organism to INH. For the purpose of display, values below the limit of detection (0.6%, dashed line) were arbitrarily set to 0.57%. P values were determined using the Mann-Whitney rank test. In all panels, error bars represent SEM.
Figure 5
Figure 5. Growing bacteria are enriched for antibiotic tolerance
(A and B) J774A.1 macrophages were infected with Mm and were treated with 100 nM dexamethasone at t=0. Macrophages were lysed at 96 hpi to release bacteria. (A) Total CFU at time of release. (B) Percent survival of released bacteria upon 48 hours exposure to 174 µM INH, 1.21 µM RIF, or left untreated. (C) J774A.1 macrophages were infected with Mm/pBP10 and total and KanR CFU enumerated at 48 and 96 hpi. The cumulative bacterial burden (CBB) was calculated as described in the Supplemental Experimental Procedures. (D) Mm/pBP10 grown intracellularly for 96 hours (described in (C)) were released by macrophage lysis and then treated for an additional 48 hours with 174 µM INH, 1.21 µM RIF, 7.48 µM MOX, or left untreated, prior to enumeration of total and KanR CFU. KanS CFU were calculated as the total CFU minus the mean KanR CFU. In all panels, error bars represent SEM, and P values were determined using Student’s t-test.
Figure 6
Figure 6. Bacterial efflux pumps confer tolerance within macrophages
(A and B) THP-1 macrophages were infected with Mm and lysed at two or 96 hpi. The released bacteria were treated for an additional 48 hours with 174 µM INH, 1.21 µM RIF or left untreated, in the presence or absence of 81.4 µM verapamil (A) or 65.7 µM reserpine (B), prior to enumeration of CFU. (C) THP-1 macrophages were infected with Mtb strain CDC1551 and lysed at two, 96 or 144 hpi. The released bacteria were then treated with antibiotics for 48 hours as described in panel (A), except that the concentration of INH was 4.4 µM, as described for Figure 4E. (D and E) THP-1 macrophages were infected with Mtb strains JHU1258c-715 (“M1”), JHU1258c-833 (“M2”) and the isogenic wild-type control, CDC 1551, for two or 96 hours prior to lysis and enumeration of CFU. (D) Released bacteria were treated as described in panel (C). (F) THP1 cells were infected with Mm for 48 hours, prior to addition of 0 (UNT), 40.7 or 81.4 µM VER for an additional 48 hours. P<0.001 using one-way ANOVA, with Dunnett’s post-test comparing each treatment group to the untreated control after 48 hours of VER treatment. (G) THP1 cells infected with Mm for two hours or 96 hours were incubated for an additional 48 hours with 174 µM INH, 1.21 µM RIF or both, and in the presence or absence of 40.7µM VER. Cells were lysed and CFU were enumerated at the end of the 48 hour treatment. Percent survival was calculated relative to the mean intracellular counts present at the start of antibiotic exposure. For all panels, error bars represent SEM. Significance testing was performed using one-way ANOVA with Dunnett’s (A,B, D and E) or Bonferroni (C and D) post-tests.
Figure 7
Figure 7. Model for the mechanism of antibiotic tolerance in TB and its treatment
Nontolerant bacteria are phagocytosed by macrophages soon after infection wherein they induce efflux pumps to counter macrophage defenses. These efflux pumps render bacteria tolerant to multiple antitubercular drugs. The tolerant bacteria are associated with the growing population because of their enhanced ability to counter macrophage defenses. Antitubercular drug treatment spares tolerant bacteria and the addition of efflux pump inhibitors reduces their numbers.

Comment in

References

    1. Akira M, Sakatani M, Ishikawa H. Transient radiographic progression during initial treatment of pulmonary tuberculosis: CT findings. J Comput Assist Tomogr. 2000;24:426–431. - PubMed
    1. Amaral L, Martins M, Viveiros M. Enhanced killing of intracellular multidrug-resistant Mycobacterium tuberculosis by compounds that affect the activity of efflux pumps. J Antimicrob Chemother. 2007;59:1237–1246. - PubMed
    1. Aubry A, Chosidow O, Caumes E, Robert J, Cambau E. Sixty-three cases of Mycobacterium marinum infection: clinical features, treatment, and antibiotic susceptibility of causative isolates. Arch Intern Med. 2002;162:1746–1752. - PubMed
    1. Barker J, Scaife H, Brown MR. Intraphagocytic growth induces an antibiotic-resistant phenotype of Legionella pneumophila. Antimicrob Agents Chemother. 1995;39:2684–2688. - PMC - PubMed
    1. Barry CE, 3rd, Boshoff HI, Dartois V, Dick T, Ehrt S, Flynn J, Schnappinger D, Wilkinson RJ, Young D. The spectrum of latent tuberculosis: rethinking the biology and intervention strategies. Nat Rev Microbiol. 2009;7:845–855. - PMC - PubMed

Publication types

MeSH terms