. 2011 Aug;15(4):414-25.
doi: 10.1016/j.media.2011.01.003. Epub 2011 Jan 26.

A Hough transform global probabilistic approach to multiple-subject diffusion MRI tractography

Affiliations

A Hough transform global probabilistic approach to multiple-subject diffusion MRI tractography

Iman Aganj et al. Med Image Anal. 2011 Aug.

Abstract

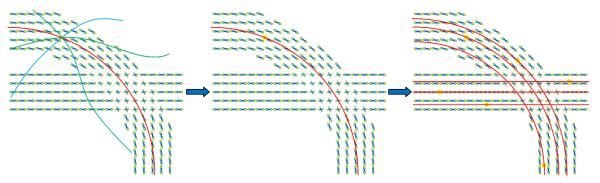
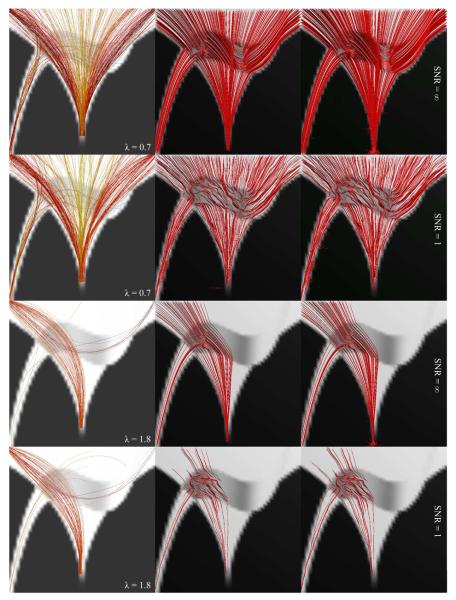
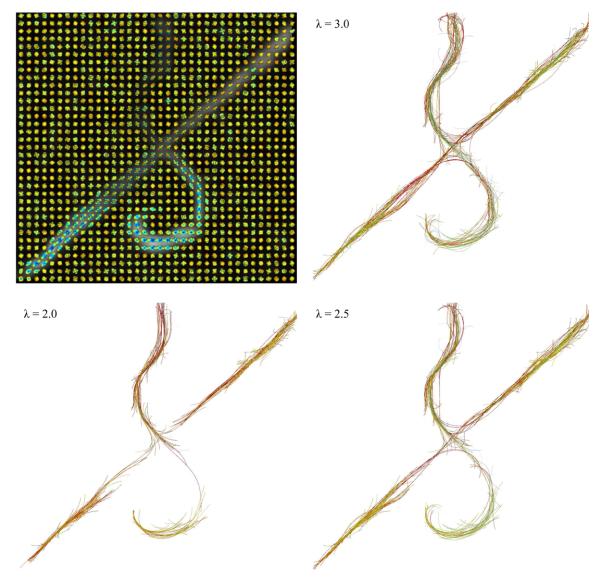
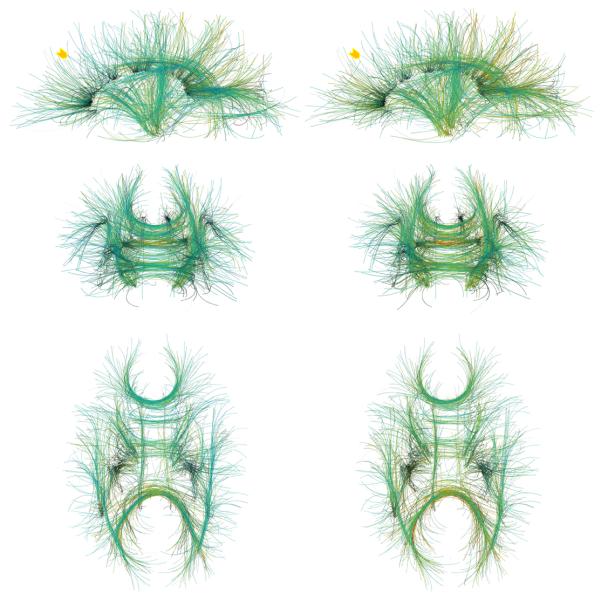
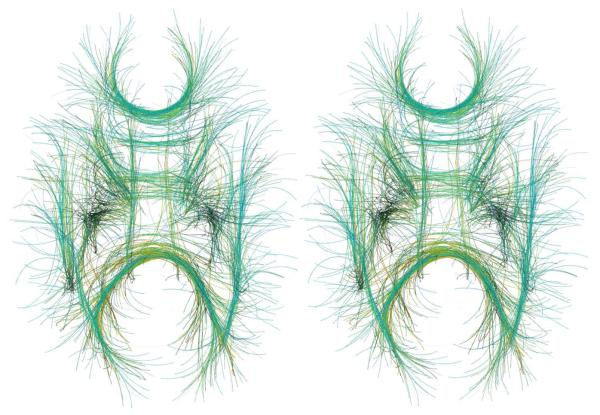
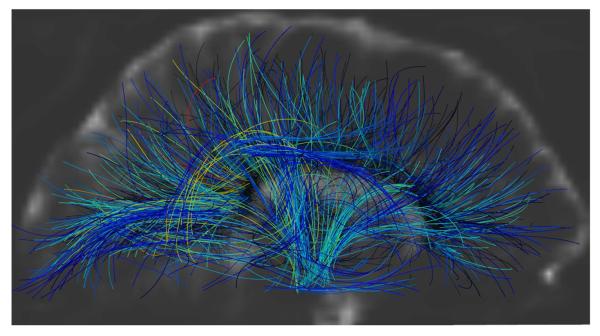
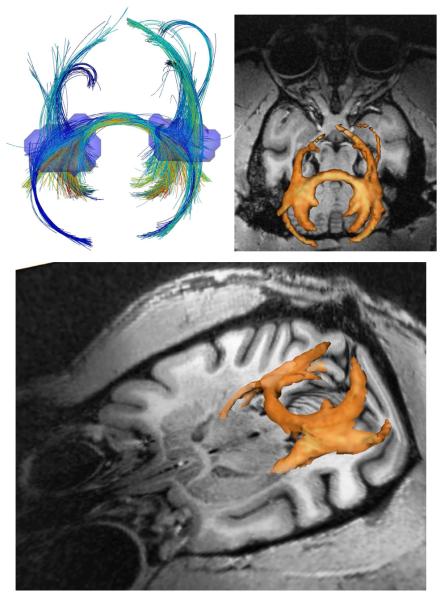
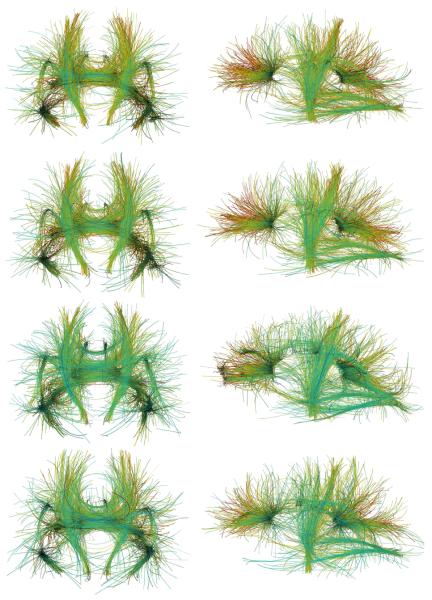
A global probabilistic fiber tracking approach based on the voting process provided by the Hough transform is introduced in this work. The proposed framework tests candidate 3D curves in the volume, assigning to each one a score computed from the diffusion images, and then selects the curves with the highest scores as the potential anatomical connections. The algorithm avoids local minima by performing an exhaustive search at the desired resolution. The technique is easily extended to multiple subjects, considering a single representative volume where the registered high-angular resolution diffusion images (HARDI) from all the subjects are non-linearly combined, thereby obtaining population-representative tracts. The tractography algorithm is run only once for the multiple subjects, and no tract alignment is necessary. We present experimental results on HARDI volumes, ranging from simulated and 1.5T physical phantoms to 7T and 4T human brain and 7T monkey brain datasets.


Figures

Fig 1
Fig 1
(Left) Different possible curves passing through a seed point are tested and their scores are computed. (Middle) The curve with the highest score is selected. (Right) The process is repeated for all the remaining seed points.
Fig 2
Fig 2
Curves starting from the seed point x⃗0 are parameterized by the arc length, s ∈ [−L,L+]. The unit tangent vector, (s), is approximated with polynomials.
Fig 3
Fig 3
Ground truth (left) and the ODFs overlaid on the GFA map (right) of the simulated phantom. The local region for the seed points and the phantom mask are indicated in respectively red and white (bottom, right).
Fig 4
Fig 4
Comparison of the proposed method (left) with streamline deterministic (middle) and probabilistic (right) techniques from 500 seed points chosen in the phantom mask (two top rows) and 80 in the region identified in Fig. 3 (bottom, right) as red (two bottom rows), in noiseless (rows 1 & 3) and noisy (rows 2 & 4) cases.
Fig 5
Fig 5
Reconstructed ODFs (top, left) and the tractography results (rest of the subfigures) on the excised rat spinal cords, using various values for the bias parameter λ.
Fig 6
Fig 6
Tractography results on a human brain HARDI dataset from 1500 seed points using polynomial orders of (left) N = 3 and (right) N = 2, shown in (top) sagittal, (middle) coronal, and (bottom) axial views. The arrows indicate areas where the computed curves are more uniformly spread out when using the higher polynomial order.
Fig 7
Fig 7
Stereoscopic rendering of Fig. 6 (bottom, left). To see this image in 3D, please cross your eyes and move the image closer or further away from you until you see what appears to be a third, 3D image in the middle. This figure would be a bonus for those who can perceive 3D with standard eye-crossing techniques.
Fig 8
Fig 8
A sagittal slice of the human brain baseline image in the middle of the computed tracts. Cerebrospinal fluid is identified as white regions.
Fig 9
Fig 9
Tractography results on a monkey brain HARDI dataset shown in axial (top) and tilted (bottom) views. 1350 seed points were randomly generated inside the transparent blue regions (top, left). Isosurface of the fiber density map is shown in orange overlaid on T1 image (top right & bottom).
Fig 10
Fig 10
Tractography results from five human brain HARDI datasets combined using geometric (top row) and arithmetic (row two) means, and from individual subjects (two bottom rows), shown in coronal (left) and sagittal (right) views.

References

    1. Aganj I, Lenglet C, Keriven R, Sapiro G, Harel N, Thompson PM. A Hough transform global approach to diffusion MRI tractography; Proc. of 17th Annual Meeting of ISMRM; Honolulu. 2009a.
    1. Aganj I, Lenglet C, Sapiro G, Chiang MC, Thompson PM. Multi-subject diffusion MRI tractography via a Hough transform global approach; Proc. of 15th Annual Meeting of OHBM; San Francisco. 2009b.
    1. Aganj I, Lenglet C, Sapiro G, Yacoub E, Ugurbil K, Harel N. Reconstruction of the orientation distribution function in single and multiple shell q-ball imaging within constant solid angle. Magnetic Resonance in Medicine. 2010;64(2):554–566. - PMC - PubMed
    1. Basser PJ, Mattiello J, LeBihan D. Estimation of the effective self-diffusion tensor from the NMR spin echo. J Magn Reson B. 1994;103(3):247–254. - PubMed
    1. Basser PJ, Pajevic S, Pierpaoli C, Duda J, Aldroubi A. In vivo fiber tractography using DT-MRI data. Magnetic Resonance in Medicine. 2000;44(4):625–632. - PubMed

Publication types

MeSH terms