

Impaired hepatitis B vaccine responses during chronic hepatitis C infection: involvement of the PD-1 pathway in regulating CD4(+) T cell responses
- PMID: 21376795
- PMCID: PMC3090659
- DOI: 10.1016/j.vaccine.2011.02.052
Impaired hepatitis B vaccine responses during chronic hepatitis C infection: involvement of the PD-1 pathway in regulating CD4(+) T cell responses
Abstract
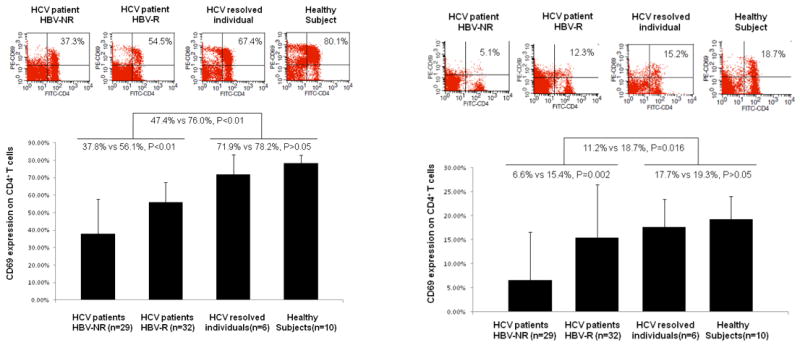
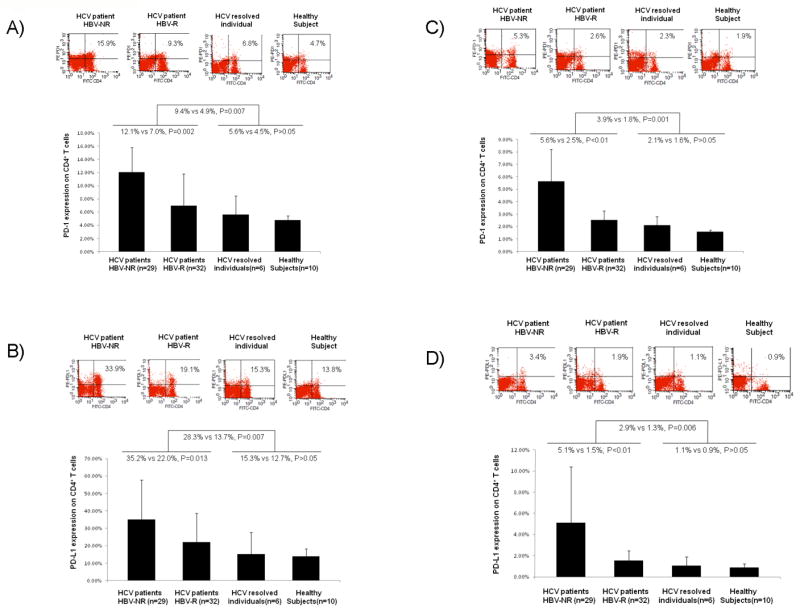
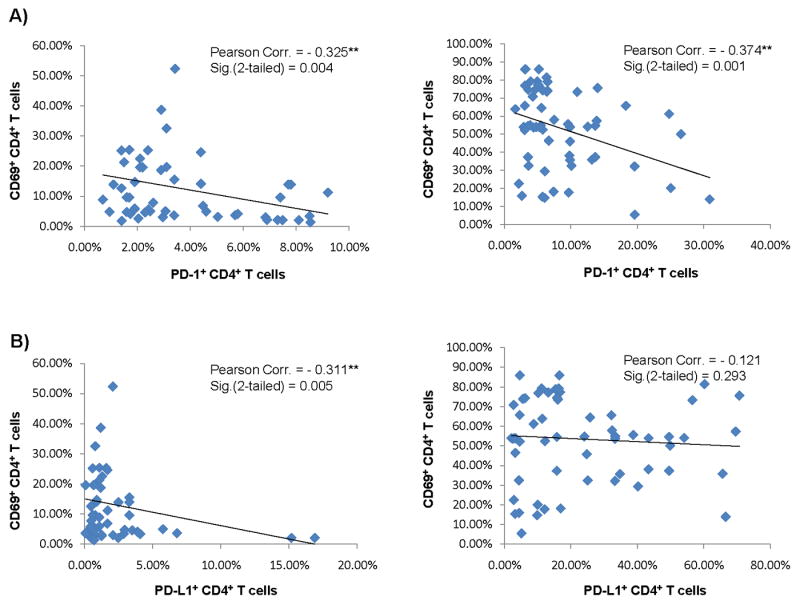
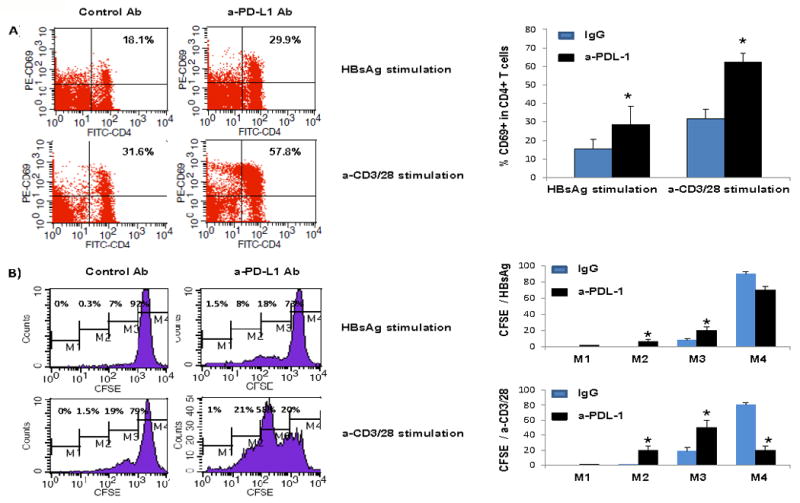
Vaccination for hepatitis B virus (HBV) in the setting of hepatitis C virus (HCV) infection is recommended, but responses to vaccination are blunted when compared to uninfected populations. The mechanism for this failure of immune response in HCV-infected subjects remains unknown but is thought to be a result of lymphocyte dysfunction during chronic viral infection. We have recently demonstrated that PD-1, a novel negative immunomodulator for T cell receptor (TCR) signaling, is involved in T and B lymphocyte dysregulation during chronic HCV infection. In this report, we further investigated the role of the PD-1 pathway in regulation of CD4(+) T cell responses to HBV vaccination in HCV-infected individuals. In a prospective HCV infected cohort, a poor response rate to HBV vaccination as assayed by seroconversion was observed in HCV-infected subjects (53%), while a high response rate was observed in healthy or spontaneously HCV-resolved individuals (94%). CD4(+) T cell responses to ex vivo stimulations of anti-CD3/CD28 antibodies or hepatitis B surface antigen (HBsAg) were found to be lower in HBV vaccine non-responders compared to those responders in HCV-infected individuals who had received a series of HBV immunizations. PD-1 expression on CD4(+) T cells was detected at relatively higher levels in these HBV vaccine non-responders than those who responded, and this was inversely associated with the cell activation status. Importantly, blocking the PD-1 pathway improved T cell activation and proliferation in response to ex vivo HBsAg or anti-CD3/CD28 stimulation in HBV vaccine non-responders. These results suggest that PD-1 signaling may be involved in impairing CD4(+) T cell responses to HBV vaccination in subjects with HCV infection, and raise the possibility that blocking this negative signaling pathway might improve success rates of immunization in the setting of chronic viral infection.
Published by Elsevier Ltd.
Figures
Similar articles
-
KLRG1 impairs CD4+ T cell responses via p16ink4a and p27kip1 pathways: role in hepatitis B vaccine failure in individuals with hepatitis C virus infection.J Immunol. 2014 Jan 15;192(2):649-57. doi: 10.4049/jimmunol.1302069. Epub 2013 Dec 13. J Immunol. 2014. PMID: 24337749 Free PMC article.
-
Tim-3 alters the balance of IL-12/IL-23 and drives TH17 cells: role in hepatitis B vaccine failure during hepatitis C infection.Vaccine. 2013 Apr 26;31(18):2238-45. doi: 10.1016/j.vaccine.2013.03.003. Epub 2013 Mar 14. Vaccine. 2013. PMID: 23499521 Free PMC article.
-
Programmed death-1 affects suppressor of cytokine signaling-1 expression in T cells during hepatitis C infection.Viral Immunol. 2010 Oct;23(5):487-95. doi: 10.1089/vim.2010.0010. Viral Immunol. 2010. PMID: 20883163 Free PMC article.
-
Immune exhaustion and immune senescence: two distinct pathways for HBV vaccine failure during HCV and/or HIV infection.Arch Immunol Ther Exp (Warsz). 2013 Jun;61(3):193-201. doi: 10.1007/s00005-013-0219-0. Epub 2013 Feb 12. Arch Immunol Ther Exp (Warsz). 2013. PMID: 23400275 Free PMC article. Review.
-
Costimulatory molecule programmed death-1 in the cytotoxic response during chronic hepatitis C.World J Gastroenterol. 2009 Nov 7;15(41):5129-40. doi: 10.3748/wjg.15.5129. World J Gastroenterol. 2009. PMID: 19891011 Free PMC article. Review.
Cited by
-
Distinct CD55 Isoform Synthesis and Inhibition of Complement-Dependent Cytolysis by Hepatitis C Virus.J Immunol. 2016 Aug 15;197(4):1127-36. doi: 10.4049/jimmunol.1600631. Epub 2016 Jun 29. J Immunol. 2016. PMID: 27357152 Free PMC article.
-
KLRG1 impairs CD4+ T cell responses via p16ink4a and p27kip1 pathways: role in hepatitis B vaccine failure in individuals with hepatitis C virus infection.J Immunol. 2014 Jan 15;192(2):649-57. doi: 10.4049/jimmunol.1302069. Epub 2013 Dec 13. J Immunol. 2014. PMID: 24337749 Free PMC article.
-
PD-1 Blockade and TLR7 Activation Lack Therapeutic Benefit in Chronic Simian Immunodeficiency Virus-Infected Macaques on Antiretroviral Therapy.Antimicrob Agents Chemother. 2019 Oct 22;63(11):e01163-19. doi: 10.1128/AAC.01163-19. Print 2019 Nov. Antimicrob Agents Chemother. 2019. PMID: 31501143 Free PMC article.
-
Direct-Acting Antiviral Treatment of HCV Infection Does Not Resolve the Dysfunction of Circulating CD8+ T-Cells in Advanced Liver Disease.Front Immunol. 2019 Aug 13;10:1926. doi: 10.3389/fimmu.2019.01926. eCollection 2019. Front Immunol. 2019. PMID: 31456810 Free PMC article.
-
Lasting differential gene expression of circulating CD8 T cells in chronic HCV infection with cirrhosis identifies a role for Hedgehog signaling in cellular hyperfunction.Front Immunol. 2024 Jun 3;15:1375485. doi: 10.3389/fimmu.2024.1375485. eCollection 2024. Front Immunol. 2024. PMID: 38887299 Free PMC article.
References
-
- Cheruvu S, Marks K, Talal AH. Understanding the pathogenesis and management of hepatitis B/HIV and hepatitis B/hepatitis C virus coinfection. Clinics in liver disease. 2007 Nov;11(4):917–43. ix–x. - PubMed
-
- Duberg AS, Torner A, Davidsdottir L, Aleman S, Blaxhult A, Svensson A, et al. Cause of death in individuals with chronic HBV and/or HCV infection, a nationwide community-based register study. Journal of viral hepatitis. 2008 Jul;15(7):538–50. - PubMed
-
- Filippini P, Coppola N, Pisapia R, Martini S, Marrocco C, Di Martino F, et al. Virological and clinical aspects of HBV-HCV coinfection in HIV positive patients. Journal of medical virology. 2007 Nov;79(11):1679–85. - PubMed
-
- Torbenson M, Kannangai R, Astemborski J, Strathdee SA, Vlahov D, Thomas DL. High prevalence of occult hepatitis B in Baltimore injection drug users. Hepatology (Baltimore, Md. 2004 Jan;39(1):51–7. - PubMed
-
- Zarski JP, Bohn B, Bastie A, Pawlotsky JM, Baud M, Bost-Bezeaux F, et al. Characteristics of patients with dual infection by hepatitis B and C viruses. Journal of hepatology. 1998 Jan;28(1):27–33. - PubMed
Publication types
MeSH terms
Substances
Grants and funding
LinkOut - more resources
Full Text Sources
Other Literature Sources
Medical
Research Materials
