

Shape alterations in the striatum in chorea-acanthocytosis
- PMID: 21377843
- PMCID: PMC3324182
- DOI: 10.1016/j.pscychresns.2010.10.006
Shape alterations in the striatum in chorea-acanthocytosis
Abstract
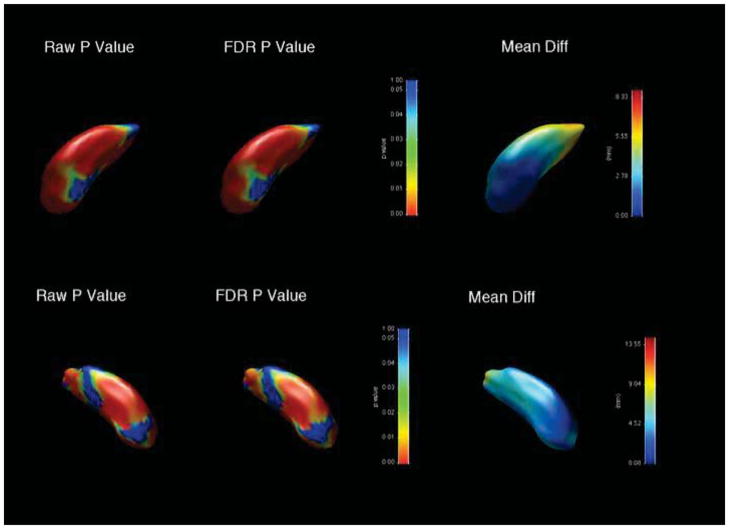
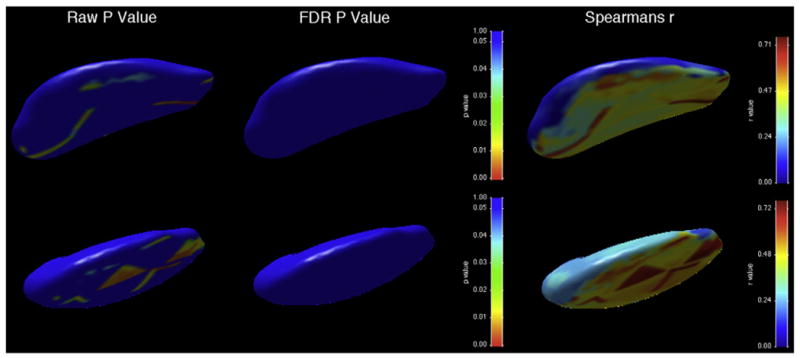
Chorea-acanthocytosis (ChAc) is an uncommon autosomal recessive disorder due to mutations of the VPS13A gene, which encodes for the membrane protein chorein. ChAc presents with progressive limb and orobuccal chorea, but there is often a marked dysexecutive syndrome. ChAc may first present with neuropsychiatric disturbance such as obsessive-compulsive disorder (OCD), suggesting a particular role for disruption to striatal structures involved in non-motor frontostriatal loops, such as the head of the caudate nucleus. Two previous studies have suggested a marked reduction in volume in the caudate nucleus and putamen, but did not examine morphometric change. We investigated morphometric change in 13 patients with genetically or biochemically confirmed ChAc and 26 age- and gender-matched controls. Subjects underwent magnetic resonance imaging and manual segmentation of the caudate nucleus and putamen, and shape analysis using a non-parametric spherical harmonic technique. Both structures showed significant and marked reductions in volume compared with controls, with reduction greatest in the caudate nucleus. Both structures showed significant shape differences, particularly in the head of the caudate nucleus. No significant correlation was shown between duration of illness and striatal volume or shape, suggesting that much structural change may have already taken place at the time of symptom onset. Our results suggest that striatal neuron loss may occur early in the disease process, and follows a dorsal-ventral gradient that may correlate with early neuropsychiatric and cognitive presentations of the disease.
Copyright © 2010 Elsevier Ireland Ltd. All rights reserved.
Figures


References
-
- Bader B, Arzberger T, Heinsen H, et al. Neuropathology of chorea-acanthocytosis. In: Walker R, Saiki S, Danek A, editors. Neuroacanthocytosis Syndromes II. Springer; Heidelberg: 2008.
-
- Bader B, Walker RH, Vogel M, et al. Tongue protrusion and feeding dystonia: a hallmark of chorea-acanthocytosis. Mov Disord. 2010;25(1):127–9. - PubMed
-
- Bookstein F. Shape and the information in medical images: a decade of the morphometric synthesis. Compu Vis Image Underst. 1997;66:97–118.
-
- Chamberlain S, Blackwell A, Fineberg N, et al. The neuropsychology of obsessive-compulsive disorder: the importance of failures in cognitive and behavioural inhibition as candidate endophenotypic markers. Neurosci Biobehav Rev. 2005;29:399–419. - PubMed
Publication types
MeSH terms
Grants and funding
LinkOut - more resources
Full Text Sources
