Comparative Study
. 2011 Sep 7;8(62):1332-45.
doi: 10.1098/rsif.2010.0678. Epub 2011 Mar 4.

Mechanical models of sandfish locomotion reveal principles of high performance subsurface sand-swimming

Affiliations
Comparative Study

Mechanical models of sandfish locomotion reveal principles of high performance subsurface sand-swimming

Ryan D Maladen et al. J R Soc Interface. .

Abstract

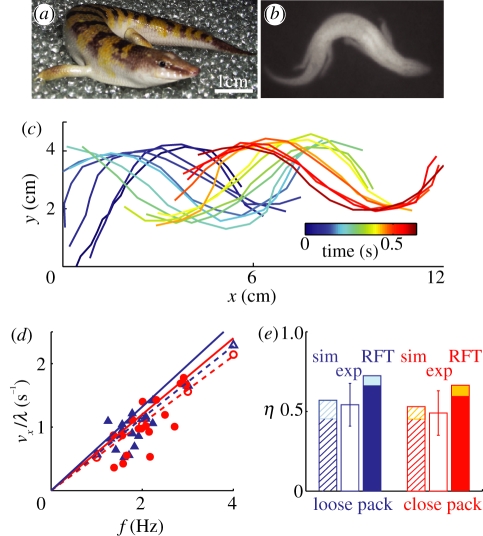
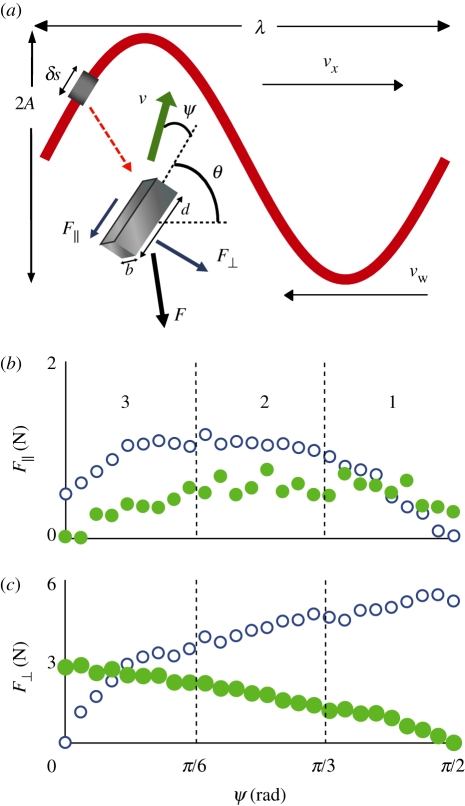
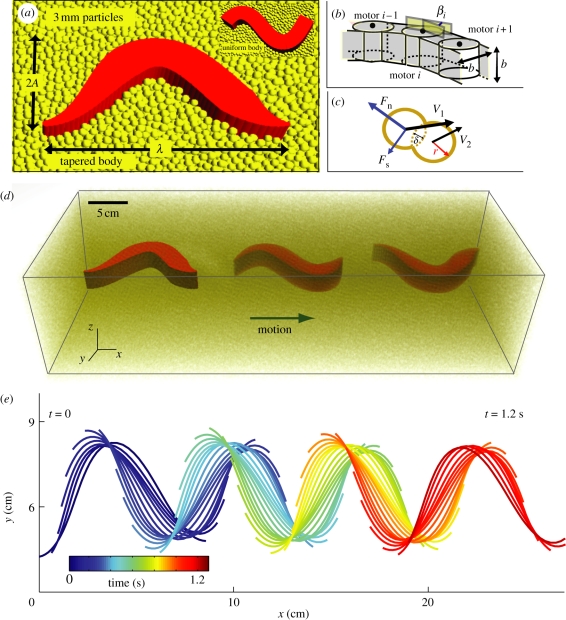
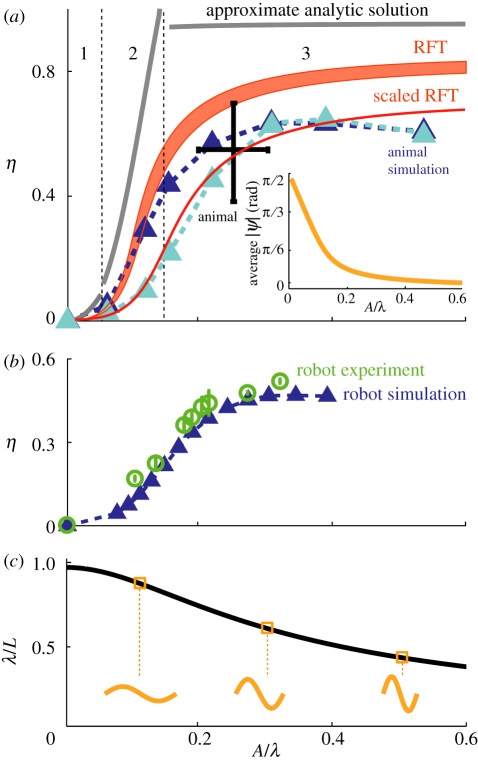
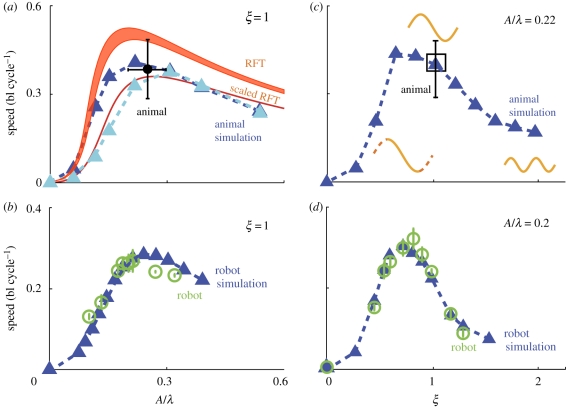
We integrate biological experiment, empirical theory, numerical simulation and a physical model to reveal principles of undulatory locomotion in granular media. High-speed X-ray imaging of the sandfish lizard, Scincus scincus, in 3 mm glass particles shows that it swims within the medium without using its limbs by propagating a single-period travelling sinusoidal wave down its body, resulting in a wave efficiency, η, the ratio of its average forward speed to the wave speed, of approximately 0.5. A resistive force theory (RFT) that balances granular thrust and drag forces along the body predicts η close to the observed value. We test this prediction against two other more detailed modelling approaches: a numerical model of the sandfish coupled to a discrete particle simulation of the granular medium, and an undulatory robot that swims within granular media. Using these models and analytical solutions of the RFT, we vary the ratio of undulation amplitude to wavelength (A/λ) and demonstrate an optimal condition for sand-swimming, which for a given A results from the competition between η and λ. The RFT, in agreement with the simulated and physical models, predicts that for a single-period sinusoidal wave, maximal speed occurs for A/λ ≈ 0.2, the same kinematics used by the sandfish.


Figures

Figure 1.
Figure 1.
Kinematics, speed and wave efficiency of the sand-swimming sandfish lizard Scincus scincus and predictions from granular resistive force theory (RFT) and numerical simulation. (a) The sandfish lizard on 3 mm glass particles. (b) X-ray image of sandfish swimming subsurface in 0.3 mm glass particles. (c) Tracked mid-line of the sandfish shows the kinematics as it propels itself using body undulations within a granular medium of 3 mm glass particles. (d) Average forward swimming speed versus undulation frequency in 3 mm particles. Solid symbols refer to biological measurements, and the solid and dashed lines correspond to the RFT (for a flat head) and simulation (for a tapered head) predictions, respectively. (e) Wave efficiency (η), the ratio of the forward swimming speed to the wave speed as determined from the slope of vx/λ versus f measured in (d) for biological data, RFT and numerical simulation in 3 mm particles. For the RFT (solid colours), the lower and upper limits of the η deviation (cyan (loosely packed) and (orange (closely packed)) correspond to maximum (flat head) and 30 per cent of the maximum head drag, while the simulation (hatched) corresponds to the flat and tapered head shapes, respectively. Blue and red colours in (d) and (e) correspond to loosely and closely packed media preparations, respectively.
Figure 2.
Figure 2.
Resistive force theory (RFT) for granular media in which the sandfish is (a) approximated by a square cross-section tube along which a single period sinusoidal travelling wave propagates head to tail. As the tube moves through the medium, a force acts on each element of the tube and the force is resolved into parallel (F) and perpendicular (F) components. δs and d refer to the length of the element in the RFT and drag experiments, respectively. (b) F and (c) F from simulation of 3 mm glass particles on the length (blue open circles) and at the end caps (green closed circles) of the square cross-section rod as a function of the angle (ψ) between the velocity direction and the rod axis. Regions 1–3 separated by dashed black vertical lines correspond to similarly marked regions of the relationship between η and A/λ in figure 6a. (Online version in colour.)
Figure 3.
Figure 3.
Numerically simulated model of the sandfish (figure 1a). (a) Close-up view of the numerical sandfish with tapered body cross section (approximating that of the animal) in 3 mm glass particles (particles above the sandfish model are rendered transparent). Inset shows the numerical sandfish with uniform body cross section. (b) Motor connections of a section of the simulated sandfish (i = 1 refers to the head). b indicates the width (maximum along the model) and height of the segments in the non-tapered section of the animal model. (c) Two representative contacting particles illustrating interaction forces given by equation (3.6). (d) Three-dimensional view of the 50 segment sandfish at three different instants while swimming within a container of particles rendered semi-transparent for visualization. The time for the simulated tapered head sandfish to swim across the container is approximately 3.5 s (f = 2 Hz). (e) Mid-line kinematics of subsurface sandfish motion in simulation when swimming at f = 2.5 Hz. (Online version in colour.)
Figure 4.
Figure 4.
Robot model of the sandfish (a) resting in a container filled with 6 mm plastic particles and (b) swimming subsurface in the same particles (X-ray image). Inset in (b) shows the motors (segments) of the robot connected via c- and l-brackets without skin.(c) Three-dimensional rendering of the numerically simulated robot swimming in 6 mm particles. (d) Simulated robot showing the angle between adjacent segments (βi) given by equation (4.2). (e) Circles in green and triangles in blue correspond to the tracked position of the head and tail segments of the robot as it swims subsurface in experiment and simulation, respectively. (Online version in colour.)
Figure 5.
Figure 5.
Comparison of robot experiment and simulation in 6 mm plastic particles. (a) Forward velocity increases linearly with undulation frequency in experiment (green open circles) and simulation (blue solid triangles). The slope of the dashed blue (simulation) and solid green (experiment) lines is the wave efficiency η with value 0.34± 0.03 in experiment and η = 0.36 ± 0.02 in simulation. (b) η versus number of segments, N, for a fixed length robot plateaus at N ≈ 15. The green box corresponds to the seven-segment robot in experiment while the horizontal black bar is the RFT prediction, η = 0.56 for a continuous robot body. Inset: schematics of 5-, 15- and 48-segment robots correspond to the η marked with similarly coloured (cyan, red and black) triangles. The robot simulation was tested at f = 2 Hz. For (a) and (b) A/λ = 0.2. We do not solve the RFT for the finite (7) segment robot as the resulting complex mathematical description provides less insight than the numerical simulation of the robot. (Online version in colour.)
Figure 6.
Figure 6.
Sand swimming performance dependence on wave parameters. Wave efficiency η versus amplitude to wavelength ratio A/λ for (a) the numerical sandfish simulation (dashed curve and triangles, f = 4 Hz) with a tapered (dark blue) and uniform (cyan) square cross-section body. The pink shaded region corresponds to the RFT prediction for square cross-section body for maximum (flat plate, lower bound) and 30% of the maximum head drag (higher bound), respectively. The black cross corresponds to the animal experiments (A/λ = 0.25 ± 0.07, η = 0.53 ± 0.16). Grey solid curves correspond to the approximate analytical RFT solutions, and are divided into regions 1, 2 and 3 by dashed black vertical lines (regions correspond to those marked in figure 2b,c). The red curve is the RFT prediction of η for a square cross-section body with maximum head drag with the net force on each element scaled by 0.5 (see text). Inset: the average of the absolute value of ψ decreases with A/λ. (b) η versus A/λ for the robot experiment (green circles) and robot simulation (blue triangles and dashed curve), f = 0.5 Hz. (c) For a fixed length undulator, the wavelength decreases with increasing amplitude. Spatial forms are depicted by orange curves.
Figure 7.
Figure 7.
Kinematics that maximize swimming speed. (a) Forward speed (in bl per cycle) measured while varying the ratio of A to λ for a single period wave. The cyan and blue dashed curves with triangles correspond to the sandfish simulation with flat and tapered heads, respectively. A third order polynomial fit to the peak of the tapered head sandfish simulation curve in identifies the maximum speed = 0.41 ± 0.01 bl cycle−1 at A/λ = 0.23 ± 0.01. The pink shaded region corresponds to the RFT prediction for square cross-section body for maximum (flat plate, lower bound) and 30% of the maximum (higher bound) head drag, maximum swimming speeds correspond to A/λ = 0.19 and A/λ = 0.21, respectively. The red curve is the RFT prediction of forward speed for a square cross-section body with maximum head drag with the net force on each element scaled by 0.5 (see text). The maximum forward speed corresponds to A/λ = 0.27. (b) Forward speed for the robot in experiment (green circles) and simulation (dashed blue curve with triangles) corresponding to varying A/λ (with ξ = 1). Fitting the peak of the robot simulation curve with a third order polynomial identifies the maximum speed = 0.28 ± 0.01 bl cycle−1 at A/λ = 0.24 ± 0.01. (c) Forward speed measured while varying ξ in the sandfish model with A/λ = 0.22. Spatial forms depicted by orange curves. (d) Forward speed for the robot in experiment (green circles) and simulation (dashed blue curve with triangles) corresponding to varying ξ (with A/λ = 0.2). For the numerical sandfish results (a,c) f = 2 Hz and for the robot experiment and simulation results (b,d) f = 0.5 Hz. Black cross (A/λ = 0.25 ± 0.07, speed = 0.39 ± 0.1 bl cycle−1) in (a) and black box (ξ = 1) in (c) correspond to measurements from animal experiment.

Similar articles

Cited by

References

    1. Drucker E., Lauder G. 1999. Locomotor forces on a swimming fish: three-dimensional vortex wake dynamics quantified using digital particle image velocimetry. J. Exp. Biol. 202, 2393–2412 - PubMed
    1. Nauen J., Lauder G. 2002. Quantification of the wake of rainbow trout (Oncorhynchus mykiss) using three-dimensional stereoscopic digital particle image velocimetry. J. Exp. Biol. 205, 3271–3279 - PubMed
    1. Hedenstrom A., Van Griethuijsen L., Rosén M., Spedding G. 2006. Vortex wakes of birds: recent developments using digital particle image velocimetry in a wind tunnel. Anim. Biol. 56, 535–54910.1163/157075606778967856 (doi:10.1163/157075606778967856) - DOI - DOI
    1. Fontaine E., Zabala F., Dickinson M., Burdick J. 2009. Wing and body motion during flight initiation in Drosophila revealed by automated visual tracking. J. Exp. Biol. 212, 1307–132310.1242/jeb.025379 (doi:10.1242/jeb.025379) - DOI - DOI - PubMed
    1. Bejan A., Marden J. 2006. Unifying constructal theory for scale effects in running, swimming and flying. J. Exp. Biol. 209, 238–24810.1242/jeb.01974 (doi:10.1242/jeb.01974) - DOI - DOI - PubMed

Publication types