. 2011 May;77(9):2992-3001.
doi: 10.1128/AEM.02988-10. Epub 2011 Mar 4.

Community structures of fecal bacteria in cattle from different animal feeding operations

Affiliations

Community structures of fecal bacteria in cattle from different animal feeding operations

Orin C Shanks et al. Appl Environ Microbiol. 2011 May.

Abstract

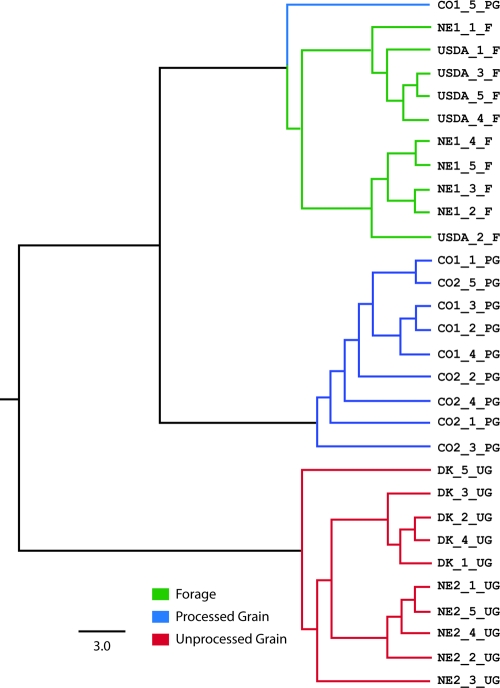
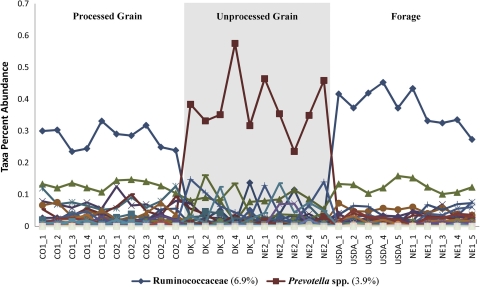
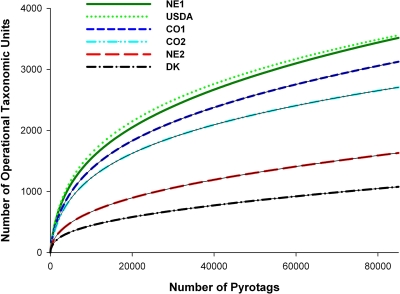
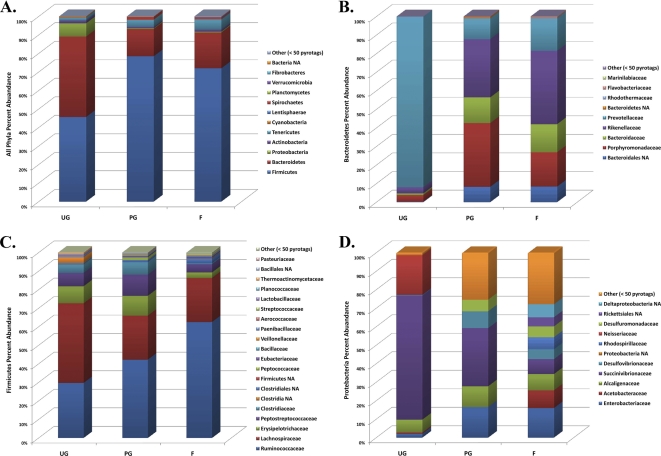
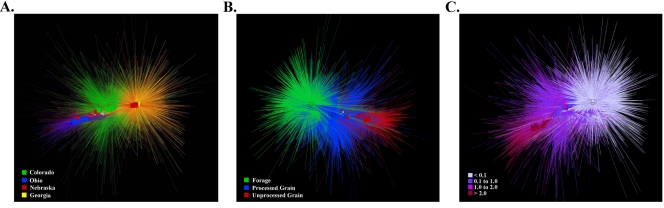
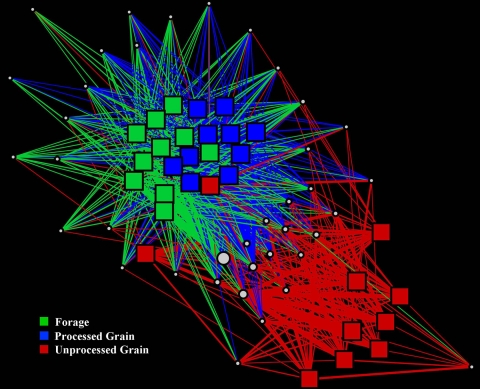
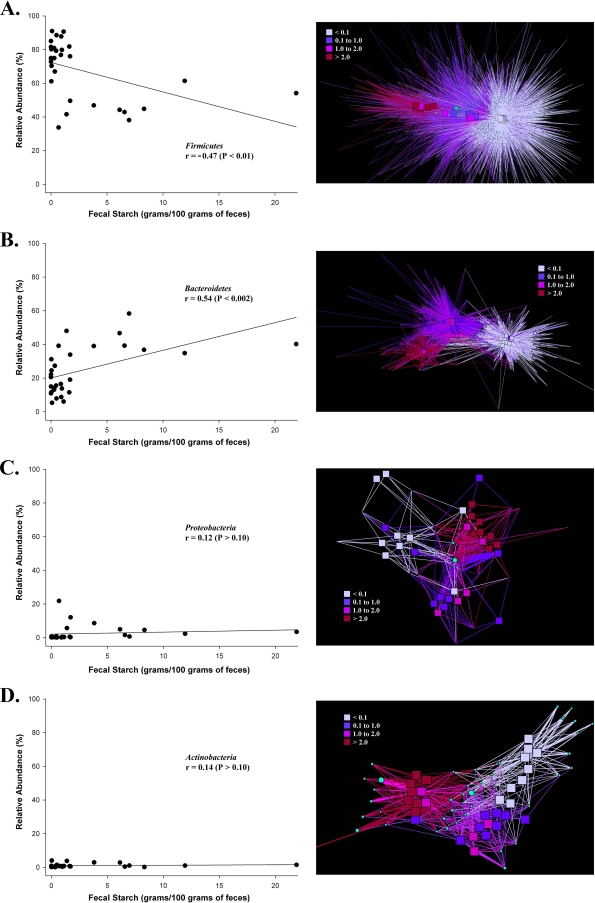
The fecal microbiome of cattle plays a critical role not only in animal health and productivity but also in food safety, pathogen shedding, and the performance of fecal pollution detection methods. Unfortunately, most published molecular surveys fail to provide adequate detail about variability in the community structures of fecal bacteria within and across cattle populations. Using massively parallel pyrosequencing of a hypervariable region of the rRNA coding region, we profiled the fecal microbial communities of cattle from six different feeding operations where cattle were subjected to consistent management practices for a minimum of 90 days. We obtained a total of 633,877 high-quality sequences from the fecal samples of 30 adult beef cattle (5 individuals per operation). Sequence-based clustering and taxonomic analyses indicate less variability within a population than between populations. Overall, bacterial community composition correlated significantly with fecal starch concentrations, largely reflected in changes in the Bacteroidetes, Proteobacteria, and Firmicutes populations. In addition, network analysis demonstrated that annotated sequences clustered by management practice and fecal starch concentration, suggesting that the structures of bovine fecal bacterial communities can be dramatically different in different animal feeding operations, even at the phylum and family taxonomic levels, and that the feeding operation is a more important determinant of the cattle microbiome than is the geographic location of the feedlot.


Figures

Fig. 1.
Fig. 1.
Fitch tree of distance estimates between individual fecal samples. Green branches mark samples from the forage management group. Blue and red branches mark samples from the processed- and unprocessed-grain groups, respectively.
Fig. 2.
Fig. 2.
Multiple-line scatter plot showing percentages of GAST taxon abundance across all 30 individual samples organized by population and management groupings. Lines are coded by color and symbol for each GAST taxon assignment. A key for the two taxa that exhibit a management grouping response in the percentage of abundance is given below the plot. The overall percentage of abundance across the entire data set for each of these two taxa is given in parentheses.
Fig. 3.
Fig. 3.
Rarefaction curves for fecal bacterial communities. Each curve represents a single fecal sample. Curves are color coded based on animal management practice; red, green, and black lines indicate unprocessed grain, processed grain, and forage, respectively. OTUs are estimated at a 3% difference level.
Fig. 4.
Fig. 4.
Stacked histograms depicting the relative abundances of high-quality bacterial V6 pyrotags in different phyla for each animal management group: unprocessed grain (UG), processed grain (PG), and forage (F). Shown are the relative abundances of taxa within all phyla (A) and within the Bacteroidetes (B), Firmicutes (C), and Proteobacteria (D) based on family taxonomic ranks. OTUs are estimated at a 3% difference level. NA, no assignment.
Fig. 5.
Fig. 5.
Network analysis of the top 95% of all high-quality bacterial V6 pyrotags after binning into OTUs and sorting by OTU abundance (from most abundant to least abundant), categorized by the geographic origin of the sample (A), the animal management grouping (B), and the fecal starch gradient (C). Squares represent fecal samples, and circles represent individual OTUs. The size of each circle indicates the OTU abundance. The line color indicates the presence of an OTU in a sample category, and the line width indicates the abundance of an OTU in a sample.
Fig. 6.
Fig. 6.
Network analysis of the top 25% of all high-quality sequences after binning into OTUs and sorting by OTU abundance (from most abundant to least abundant), categorized by animal management practice. Squares represent fecal samples, and circles represent individual OTUs. The size of a circle indicates the OTU abundance. The line color indicates the presence of an OTU in a sample category, and the line width indicates the abundance of an OTU in a sample.
Fig. 7.
Fig. 7.
Responses of Firmicutes (A), Bacteroidetes (B), Proteobacteria (C), and Actinobacteria (D) populations to fecal starch concentrations. Scatter plots depict the relative abundance of the phylum plotted against the fecal starch concentrations of the respective samples. The correlation coefficient (r) based on a simple linear regression model is given in each graph. Corresponding bacterial networks represent the top 95% of each phylum's high-quality sequences after binning and sorting by OTU abundance (from most abundant to least abundant), categorized by fecal starch concentration. Squares represent fecal samples, and circles represent individual OTUs. The size of a circle indicates the OTU abundance. The line color indicates the presence of an OTU in a sample category, and the line width indicates the abundance of an OTU in a sample.

Similar articles

Cited by

References

    1. Andersson A. F., et al. 2008. Comparative analysis of human gut microbiota by barcoded pyrosequencing. PLoS One 3:e2836. - PMC - PubMed
    1. Archibeque S. L., Miller D. N., Freetly H. C., Ferrell C. L. 2006. Feeding high-moisture corn instead of dry-rolled corn reduces odorous compound production in manure of finishing beef cattle with decreasing performance. J. Anim. Sci. 84:1767–1777 - PubMed
    1. Armstrong G. L., Hollingsworth J., Morris J. G. 1996. Emerging foodborne pathogens: Escherichia coli O157:H7 as a model of entry of a new pathogen into the food supply of the developed world. Epidemiol. Rev. 18:29–51 - PubMed
    1. Balarajan R., et al. 1991. Health risks associated with bathing in sea water. BMJ 303:1444–1445 - PMC - PubMed
    1. Benenson A. S. 1995. Control of communicable diseases manual, 16th ed. American Public Health Association, Washington, DC

Publication types