

Review
doi: 10.1369/0022155411398487.
Quantum dots in cell biology
Affiliations
- PMID: 21378278
- PMCID: PMC3201154
- DOI: 10.1369/0022155411398487
Item in Clipboard
Review
Quantum dots in cell biology
J Histochem Cytochem.
2011 Mar.
Abstract
Quantum dots are semiconductor nanocrystals that have broad excitation spectra, narrow emission spectra, tunable emission peaks, long fluorescence lifetimes, negligible photobleaching, and ability to be conjugated to proteins, making them excellent probes for bioimaging applications. Here the author reviews the advantages and disadvantages of using quantum dots in bioimaging applications, such as single-particle tracking and fluorescence resonance energy transfer, to study receptor-mediated transport.
Conflict of interest statement
The author(s) declared no potential conflicts of interest with respect to the authorship and/or publication of this article.
Figures
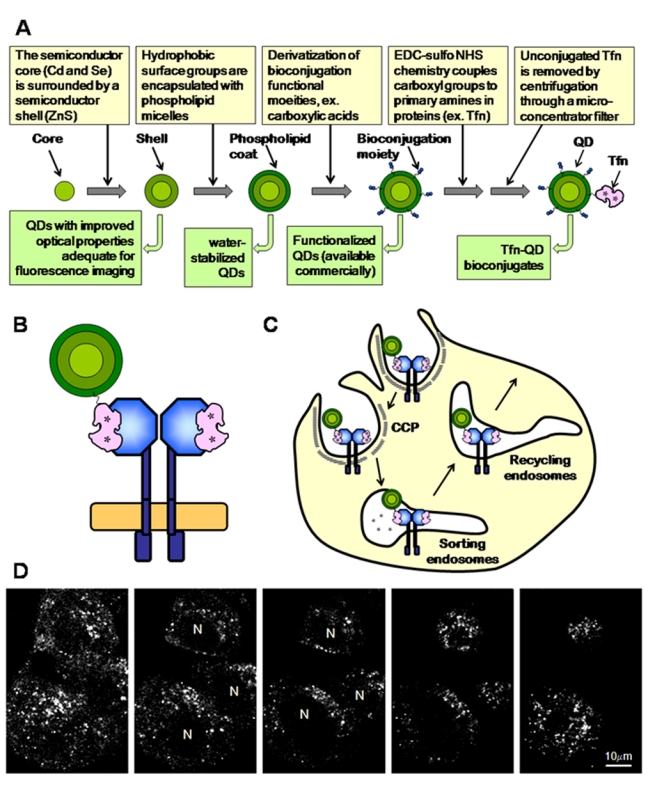
(A) Generation of transferrin (Tfn)–quantum dot (QD) bioconjugates. (B) Two molecules of Tfn (iron bound; asterisks) bind each transferrin receptor (TFR) dimer at the plasma membrane. In this particular example, one QD–Tfn and one unlabeled Tfn bind a TFR dimer. (C) TFR–Tfn complexes are internalized via clathrin-coated pits (CCP) and delivered to endosomes by clathrin-coated vesicles. Upon endosome acidification, iron is released from Tfn, and then the TFR–Tfn complexes are recycled back to the plasma membrane (PM) via recycling endosomes. (D) Endocytic uptake of Tfn–QD580 leads to a tubulo-vesicular staining throughout the cell. Confocal images were collected via a vertical z-scan with a 1-µm interval.
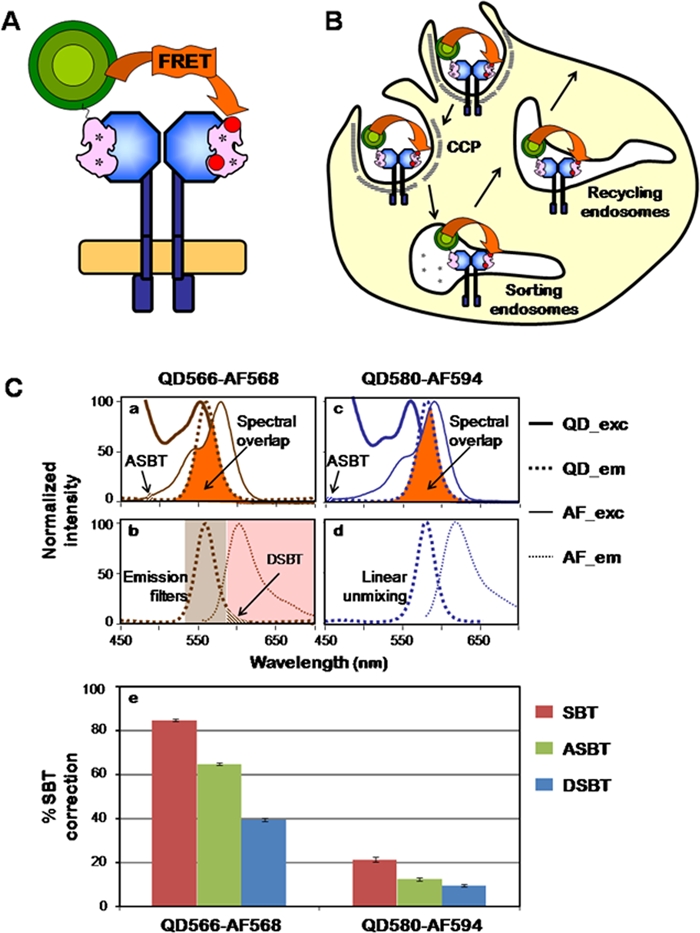
Fluorescence resonance energy transfer (FRET) reactions between transferrin (Tfn)–quantum dot (QD) (donor) and Tfn–Alexa Fluor (AF) (acceptor) conjugates. (A) Here, one donor QD–Tfn and one acceptor AF–Tfn bind a transferrin receptor (TFR) dimer. (B) Energy transfer (FRET) occurs between Tfn–QD (donor) and Tfn–AF (acceptor) upon their binding to the TFR homodimer at the plasma membrane and throughout the endocytic pathway. (C) The spectra of QD566 and QD580 are available from Evident Technologies (Troy, NY) and eBioscience (San Diego, CA), and those of AF568 and AF594 are available from Invitrogen (Carlsbad, CA). Panels a, b: Excitation and emission spectra of QD566–AF568. The orange area indicates the spectral overlap between the QD566 (donor) emission (left panel; Qem) and the AF568 (acceptor) excitation spectra (left panel; AFex). Excitation of AF568 at the 488-nm donor laser excitation determines acceptor spectral bleedthrough (ASBT) levels, whereas the emission of QD566 collected by the emission filter LP590 represents donor spectral bleedthrough (DSBT) levels (McGrath and Barroso 2008). Panels c, d: Excitation and emission spectra of QD580–AF594. The orange area indicates the spectral overlap between the QD580 (donor) emission (right panel; QDem) and the AF594 (acceptor) excitation spectra (right panel; AFex). The 458-nm and 514-nm argon laser lines were used for QD580 and AF594 excitation, respectively. Excitation of AF594 at the 458-nm donor laser excitation determines ASBT levels. QD580 and AF594 reference spectra were used to separate their respective emission spectra using linear unmixing and therefore remove DSBT from uncorrected FRET (uFRET) images (McGrath and Barroso 2008). Dex, donor excitation wavelength spectrum; Aex, acceptor excitation wavelength spectrum; Dem, donor emission wavelength spectrum; Aem, acceptor emission wavelength spectrum; dotted line, emission; solid line, excitation; brown line, QD566/AF568; blue line, QD580/AF594; brown shaded rectangle represents the donor emission filter (BP535-590) and red shaded rectangle the acceptor emission filter (LP590). Panel e: Role of ASBT (green) and DSBT (blue) in the overall SBT (red) correction after FRET processing. QD566–AF568 FRET pair shows higher ASBT due to the excitation of AF568 at the 488-nm donor laser excitation, whereas QD580–AF594 shows overall lower SBT correction because ASBT is lower due to the reduced level of excitation of AF594 at the 458-nm donor laser excitation, and DSBT is removed completely by linear unmixing separation of the QD580 and AF594 emission spectra. Nevertheless, comparable E% levels are obtained for both FRET pairs, thus validating this QD-based FRET system (McGrath and Barroso 2008).
References
-
- Alcor D, Gouzer G, Triller A. 2009. Single-particle tracking methods for the study of membrane receptors dynamics. Eur J Neurosci. 30:987–997 - PubMed
-
- Algar WR, Krull UJ. 2008. Quantum dots as donors in fluorescence resonance energy transfer for the bioanalysis of nucleic acids, proteins, and other biological molecules. Anal Bioanal Chem. 391:1609–1618 - PubMed
-
- Anas A, Okuda T, Kawashima N, Nakayama K, Itoh T, Ishikawa M, Biju V. 2009. Clathrin-mediated endocytosis of quantum dot–peptide conjugates in living cells. ACS Nano. 3:2419–2429 - PubMed
Publication types
MeSH terms
Substances
LinkOut - more resources
Full Text Sources
Other Literature Sources
