

First principles modeling of nonlinear incidence rates in seasonal epidemics
- PMID: 21379320
- PMCID: PMC3040644
- DOI: 10.1371/journal.pcbi.1001079
First principles modeling of nonlinear incidence rates in seasonal epidemics
Abstract
In this paper we used a general stochastic processes framework to derive from first principles the incidence rate function that characterizes epidemic models. We investigate a particular case, the Liu-Hethcote-van den Driessche's (LHD) incidence rate function, which results from modeling the number of successful transmission encounters as a pure birth process. This derivation also takes into account heterogeneity in the population with regard to the per individual transmission probability. We adjusted a deterministic SIRS model with both the classical and the LHD incidence rate functions to time series of the number of children infected with syncytial respiratory virus in Banjul, Gambia and Turku, Finland. We also adjusted a deterministic SEIR model with both incidence rate functions to the famous measles data sets from the UK cities of London and Birmingham. Two lines of evidence supported our conclusion that the model with the LHD incidence rate may very well be a better description of the seasonal epidemic processes studied here. First, our model was repeatedly selected as best according to two different information criteria and two different likelihood formulations. The second line of evidence is qualitative in nature: contrary to what the SIRS model with classical incidence rate predicts, the solution of the deterministic SIRS model with LHD incidence rate will reach either the disease free equilibrium or the endemic equilibrium depending on the initial conditions. These findings along with computer intensive simulations of the models' Poincaré map with environmental stochasticity contributed to attain a clear separation of the roles of the environmental forcing and the mechanics of the disease transmission in shaping seasonal epidemics dynamics.
Conflict of interest statement
The authors have declared that no competing interests exist.
Figures


 becomes a function of time (see “Qualitative analysis of the fitted SIRS models”). If the strength of seasonality
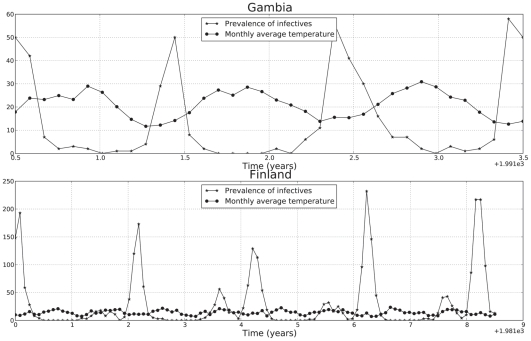
  is large enough as it is the case in Finland, the limit cycle undergoes a period doubling bifurcation creating a small loop in the phase plane. This loop corresponds to the alternating small epidemic outbreaks observed in the predicted and recorded time series of infected individuals for Finland.
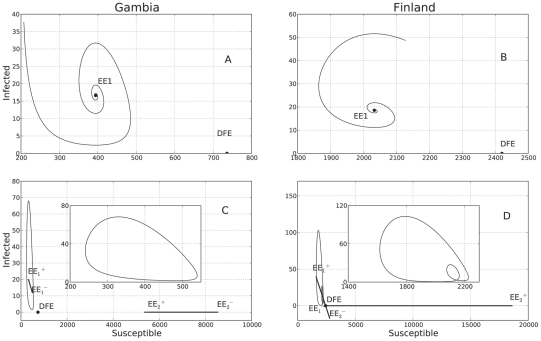
 becomes a function of time (see “Qualitative analysis of the fitted SIRS models”). If the strength of seasonality
  is large enough as it is the case in Finland, the limit cycle undergoes a period doubling bifurcation creating a small loop in the phase plane. This loop corresponds to the small alternating epidemic outbreaks observed in the predicted and recorded time series of infected individuals for Finland.
 was
was  and both the initial and final states of the trajectory are in a neighborhood of the attractor. In panels C and D
  was
was  . Note that in the classical model increasing the environmental noise results in transient visits to the disease free equilibrium stable submanifold (panel C), whereas in the LHD model, with a large enough perturbation the trajectory visits the disease free equilibrium basin of attraction and remains there.
References
-
- Hethcote H. A thousand and one epidemic models. In: Levin S, editor. Frontiers in Mathematical Biology. Lecture Notes in Biomathematics 100. Berlin: Springer; 1994. pp. 504–515.
-
- Hethcote H. The mathematics of infectious diseases. SIAM rev. 2000;42:599–653.
-
- Hethcote H, Driessche P. Some epidemiological models with nonlinear incidence. J Math Biol. 1991;29:271–287. - PubMed
-
- Allen L. Some Discrete-Time SI, S/R, and S/S Epidemic Models. Math Biosci. 1994;124:83–105. - PubMed
-
- Allen L, Burgin A. Comparison of deterministic and stochastic SIS and SIR models in discrete time. Math Biosci. 2000;163:1–33. - PubMed
Publication types
MeSH terms
LinkOut - more resources
Full Text Sources
