

Risk alleles for systemic lupus erythematosus in a large case-control collection and associations with clinical subphenotypes
- PMID: 21379322
- PMCID: PMC3040652
- DOI: 10.1371/journal.pgen.1001311
Risk alleles for systemic lupus erythematosus in a large case-control collection and associations with clinical subphenotypes
Abstract
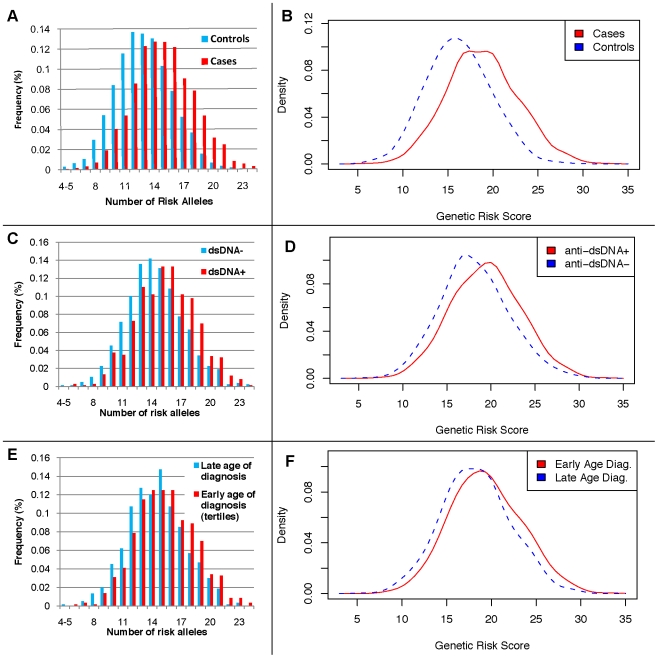
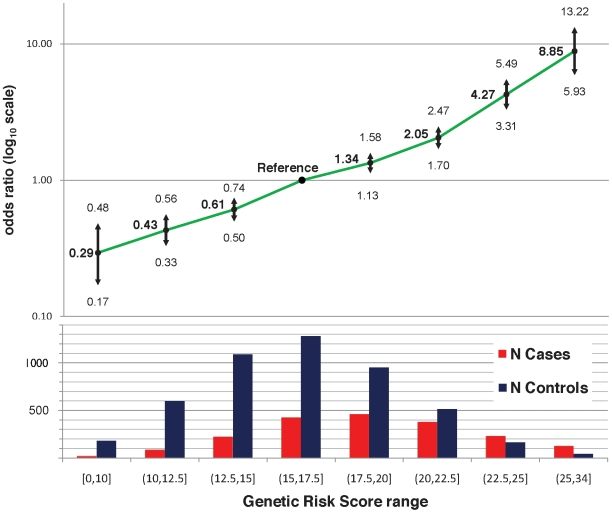
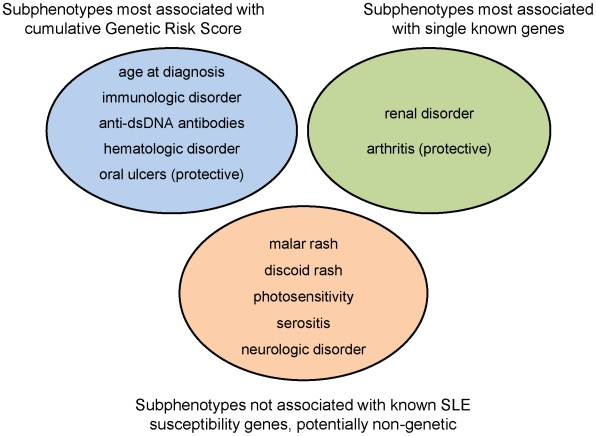
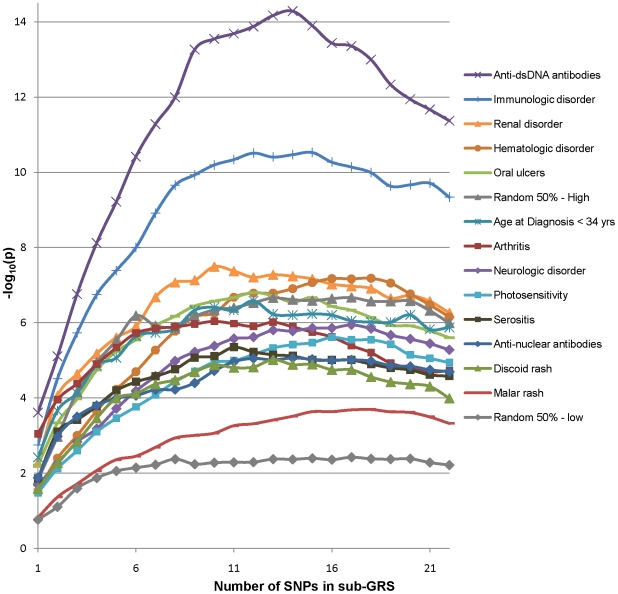
Systemic lupus erythematosus (SLE) is a genetically complex disease with heterogeneous clinical manifestations. Recent studies have greatly expanded the number of established SLE risk alleles, but the distribution of multiple risk alleles in cases versus controls and their relationship to subphenotypes have not been studied. We studied 22 SLE susceptibility polymorphisms with previous genome-wide evidence of association (p < 5 x 10⁻¹²⁸) in 1919 SLE cases from 9 independent Caucasian SLE case series and 4813 independent controls. The mean number of risk alleles in cases was 15.1 (SD 3.1) while the mean in controls was 13.1 (SD 2.8), with trend p = 4 x 10⁻⁸. We defined a genetic risk score (GRS) for SLE as the number of risk alleles with each weighted by the SLE risk odds ratio (OR). The OR for high-low GRS tertiles, adjusted for intra-European ancestry, sex, and parent study, was 4.4 (95% CI 3.8-5.1). We studied associations of individual SNPs and the GRS with clinical manifestations for the cases: age at diagnosis, the 11 American College of Rheumatology classification criteria, and double-stranded DNA antibody (anti-dsDNA) production. Six subphenotypes were significantly associated with the GRS, most notably anti-dsDNA (OR(high-low) = 2.36, p = 9e-9), the immunologic criterion (OR(high-low) = 2.23, p = 3e-7), and age at diagnosis (OR(high-low) = 1.45, p = 0.0060). Finally, we developed a subphenotype-specific GRS (sub-GRS) for each phenotype with more power to detect cumulative genetic associations. The sub-GRS was more strongly associated than any single SNP effect for 5 subphenotypes (the above plus hematologic disorder and oral ulcers), while single loci are more significantly associated with renal disease (HLA-DRB1, OR = 1.37, 95% CI 1.14-1.64) and arthritis (ITGAM, OR = 0.72, 95% CI 0.59-0.88). We did not observe significant associations for other subphenotypes, for individual loci or the sub-GRS. Thus our analysis categorizes SLE subphenotypes into three groups: those having cumulative, single, and no known genetic association with respect to the currently established SLE risk loci.
Conflict of interest statement
RRG and TWB are full-time employees of Genentech.
Figures
References
-
- Graham RR, Hom G, Ortmann W, Behrens TW. Review of recent genome-wide association scans in lupus. J Intern Med. 2009;265:680–688. - PubMed
-
- Hom G, Graham RR, Modrek B, Taylor KE, Ortmann W, et al. Association of Systemic Lupus Erythematosus with C8orf13-BLK and ITGAM-ITGAX. N Engl J Med. 2008;358:900–909. - PubMed
Publication types
MeSH terms
Substances
Grants and funding
- R01 AR046588/AR/NIAMS NIH HHS/United States
- N01 AI095386/AI/NIAID NIH HHS/United States
- M01 RR-00079/RR/NCRR NIH HHS/United States
- KL2 RR024130/RR/NCRR NIH HHS/United States
- K24 AR002213/AR/NIAMS NIH HHS/United States
- AR043815/AR/NIAMS NIH HHS/United States
- R01 HL054900/HL/NHLBI NIH HHS/United States
- M01-RR000056/RR/NCRR NIH HHS/United States
- AR052300/AR/NIAMS NIH HHS/United States
- RR024130/RR/NCRR NIH HHS/United States
- HL054900/HL/NHLBI NIH HHS/United States
- AI024717/AI/NIAID NIH HHS/United States
- R01 AI068759/AI/NIAID NIH HHS/United States
- AR043727/AR/NIAMS NIH HHS/United States
- U54 RR020278/RR/NCRR NIH HHS/United States
- R01 AI063274/AI/NIAID NIH HHS/United States
- M01 RR000079/RR/NCRR NIH HHS/United States
- AR043814/AR/NIAMS NIH HHS/United States
- P20 RR020143/RR/NCRR NIH HHS/United States
- AI068759/AI/NIAID NIH HHS/United States
- UL1 RR025005/RR/NCRR NIH HHS/United States
- N01 AR012256/AR/NIAMS NIH HHS/United States
- M01 RR000056/RR/NCRR NIH HHS/United States
- R56 AI063274/AI/NIAID NIH HHS/United States
- HL074165/HL/NHLBI NIH HHS/United States
- P30 AR053483/AR/NIAMS NIH HHS/United States
- AR044804/AR/NIAMS NIH HHS/United States
- AR042460/AR/NIAMS NIH HHS/United States
- RR020143/RR/NCRR NIH HHS/United States
- AR043247/AR/NIAMS NIH HHS/United States
- AR052125/AR/NIAMS NIH HHS/United States
- N01 AR062277/AR/NIAMS NIH HHS/United States
- R01 AR052125/AR/NIAMS NIH HHS/United States
- AI063274/AI/NIAID NIH HHS/United States
- RC1 AR058621/AR/NIAMS NIH HHS/United States
- R01 AR043814/AR/NIAMS NIH HHS/United States
- R37 AI024717/AI/NIAID NIH HHS/United States
- R01 AR042460/AR/NIAMS NIH HHS/United States
- M01 RR000052/RR/NCRR NIH HHS/United States
- R01 AI024717/AI/NIAID NIH HHS/United States
- R01 HL074165/HL/NHLBI NIH HHS/United States
- R01 AR043727/AR/NIAMS NIH HHS/United States
- R01 CA141700/CA/NCI NIH HHS/United States
- AR046588/AR/NIAMS NIH HHS/United States
- AR002213/AR/NIAMS NIH HHS/United States
- U54 RR020278-01/RR/NCRR NIH HHS/United States
- R01 AR052300/AR/NIAMS NIH HHS/United States
- K24 AR002175/AR/NIAMS NIH HHS/United States
- M01 RR-00052/RR/NCRR NIH HHS/United States
LinkOut - more resources
Full Text Sources
Other Literature Sources
Medical
Research Materials
