Genome-wide association of familial late-onset Alzheimer's disease replicates BIN1 and CLU and nominates CUGBP2 in interaction with APOE
- PMID: 21379329
- PMCID: PMC3040659
- DOI: 10.1371/journal.pgen.1001308
Genome-wide association of familial late-onset Alzheimer's disease replicates BIN1 and CLU and nominates CUGBP2 in interaction with APOE
Abstract
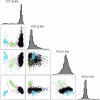
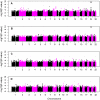
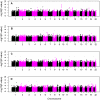
Late-onset Alzheimer's disease (LOAD) is the most common form of dementia in the elderly. The National Institute of Aging-Late Onset Alzheimer's Disease Family Study and the National Cell Repository for Alzheimer's Disease conducted a joint genome-wide association study (GWAS) of multiplex LOAD families (3,839 affected and unaffected individuals from 992 families plus additional unrelated neurologically evaluated normal subjects) using the 610 IlluminaQuad panel. This cohort represents the largest family-based GWAS of LOAD to date, with analyses limited here to the European-American subjects. SNPs near APOE gave highly significant results (e.g., rs2075650, p = 3.2×10(-81)), but no other genome-wide significant evidence for association was obtained in the full sample. Analyses that stratified on APOE genotypes identified SNPs on chromosome 10p14 in CUGBP2 with genome-wide significant evidence for association within APOE ε4 homozygotes (e.g., rs201119, p = 1.5×10(-8)). Association in this gene was replicated in an independent sample consisting of three cohorts. There was evidence of association for recently-reported LOAD risk loci, including BIN1 (rs7561528, p = 0.009 with, and p = 0.03 without, APOE adjustment) and CLU (rs11136000, p = 0.023 with, and p = 0.008 without, APOE adjustment), with weaker support for CR1. However, our results provide strong evidence that association with PICALM (rs3851179, p = 0.69 with, and p = 0.039 without, APOE adjustment) and EXOC3L2 is affected by correlation with APOE, and thus may represent spurious association. Our results indicate that genetic structure coupled with ascertainment bias resulting from the strong APOE association affect genome-wide results and interpretation of some recently reported associations. We show that a locus such as APOE, with large effects and strong association with disease, can lead to samples that require appropriate adjustment for this locus to avoid both false positive and false negative evidence of association. We suggest that similar adjustments may also be needed for many other large multi-site studies.
Conflict of interest statement
The authors have declared that no competing interests exist.
Figures


References
-
- Mayeux R. Epidemiology of neurodegeneration. Annu Rev Neurosci. 2003;26:81–104. - PubMed
-
- Fratiglioni L, De Ronchi D, Aguero-Torres H. Worldwide prevalence and incidence of dementia. Drugs & Aging. 1999;15:365–375. - PubMed
-
- Gatz M, Reynolds CA, Fratiglioni L, Johansson B, Mortimer JA, et al. Role of genes and environments for explaining Alzheimer disease. Arch Gen Psychiatry. 2006;63:168–174. - PubMed
-
- Bergem ALM, Lannfelt L. Apolipoprotein E type epsilon 4 allele, heritability and age at onset in twins with Alzheimer's disease. Clin Genet. 1997;52:408–413. - PubMed
-
- Meyer JM, Breitner JCS. Multiple threshold model for the onset of Alzheimer's disease in the NAS-NRC twin panel. Am J Med Genet. 1998;81:92–97. - PubMed
Publication types
MeSH terms
Substances
Grants and funding
- P30 AG010124/AG/NIA NIH HHS/United States
- P30 AG028377/AG/NIA NIH HHS/United States
- P50 AG005142/AG/NIA NIH HHS/United States
- P01AG07232/AG/NIA NIH HHS/United States
- R01 AG041797/AG/NIA NIH HHS/United States
- P50 AG005138/AG/NIA NIH HHS/United States
- R01 AG027224/AG/NIA NIH HHS/United States
- P30AG10161/AG/NIA NIH HHS/United States
- P50 AG016582/AG/NIA NIH HHS/United States
- P30 AG028383/AG/NIA NIH HHS/United States
- P30AG028377/AG/NIA NIH HHS/United States
- R01 AG015819/AG/NIA NIH HHS/United States
- P30 AG013854/AG/NIA NIH HHS/United States
- P50AG05134/AG/NIA NIH HHS/United States
- P30AG028383/AG/NIA NIH HHS/United States
- P50AG005133/AG/NIA NIH HHS/United States
- P50AG016582/AG/NIA NIH HHS/United States
- P30 AG010133/AG/NIA NIH HHS/United States
- U24 AG021886/AG/NIA NIH HHS/United States
- P50 AG005128/AG/NIA NIH HHS/United States
- P50AG08702/AG/NIA NIH HHS/United States
- P50 AG008702/AG/NIA NIH HHS/United States
- P50AG165574/AG/NIA NIH HHS/United States
- P50AG016579/AG/NIA NIH HHS/United States
- P01 AG003991/AG/NIA NIH HHS/United States
- P50 AG005681/AG/NIA NIH HHS/United States
- P01AG05138/AG/NIA NIH HHS/United States
- P30 AG013846/AG/NIA NIH HHS/United States
- U24 AG056270/AG/NIA NIH HHS/United States
- P30AG10124/AG/NIA NIH HHS/United States
- P30AG12300/AG/NIA NIH HHS/United States
- P01 AG007232/AG/NIA NIH HHS/United States
- P50AG05142/AG/NIA NIH HHS/United States
- P30AG13854/AG/NIA NIH HHS/United States
- R37AG015473/AG/NIA NIH HHS/United States
- P01AG03991/AG/NIA NIH HHS/United States
- P50 AG005136/AG/NIA NIH HHS/United States
- P30 AG012300/AG/NIA NIH HHS/United States
- U24AG021886/AG/NIA NIH HHS/United States
- HHSN268200782096C/HG/NHGRI NIH HHS/United States
- R01AG027224/AG/NIA NIH HHS/United States
- P01AG02219/AG/NIA NIH HHS/United States
- P50 AG005134/AG/NIA NIH HHS/United States
- P30 AG008017/AG/NIA NIH HHS/United States
- P30 AG010161/AG/NIA NIH HHS/United States
- P50AG05128/AG/NIA NIH HHS/United States
- P30AG013846/AG/NIA NIH HHS/United States
- R37 AG015473/AG/NIA NIH HHS/United States
- U24 AG026395/AG/NIA NIH HHS/United States
- P30AG008017/AG/NIA NIH HHS/United States
- P30AG010133/AG/NIA NIH HHS/United States
- P50AG05136/AG/NIA NIH HHS/United States
- P50 AG005133/AG/NIA NIH HHS/United States
- P01 AG002219/AG/NIA NIH HHS/United States
- U24AG026395/AG/NIA NIH HHS/United States
- P50AG05681/AG/NIA NIH HHS/United States
LinkOut - more resources
Full Text Sources
Other Literature Sources
Medical
Research Materials
Miscellaneous

