. 2011 Feb;7(2):e1001312.
doi: 10.1371/journal.pgen.1001312. Epub 2011 Feb 17.

Characterization of transcriptome remodeling during cambium formation identifies MOL1 and RUL1 as opposing regulators of secondary growth

Affiliations

Characterization of transcriptome remodeling during cambium formation identifies MOL1 and RUL1 as opposing regulators of secondary growth

Javier Agusti et al. PLoS Genet. 2011 Feb.

Abstract

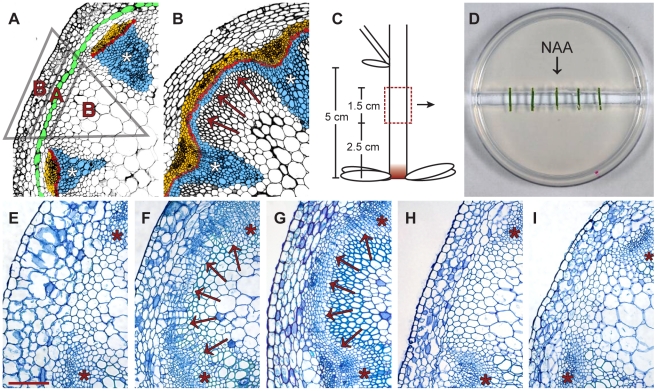
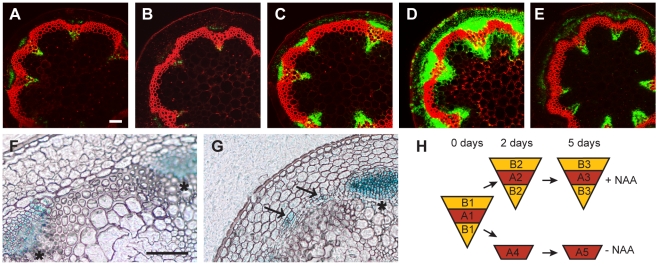
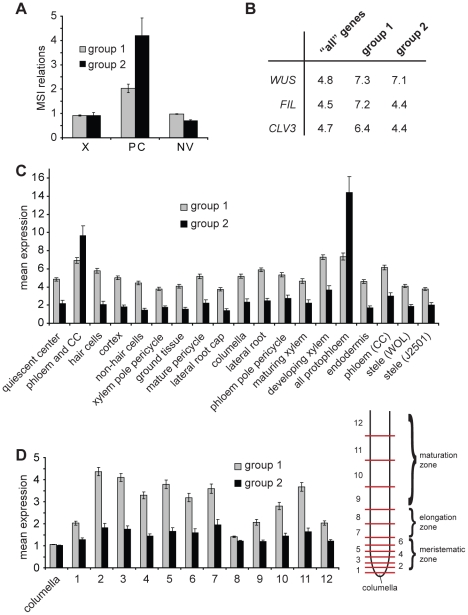
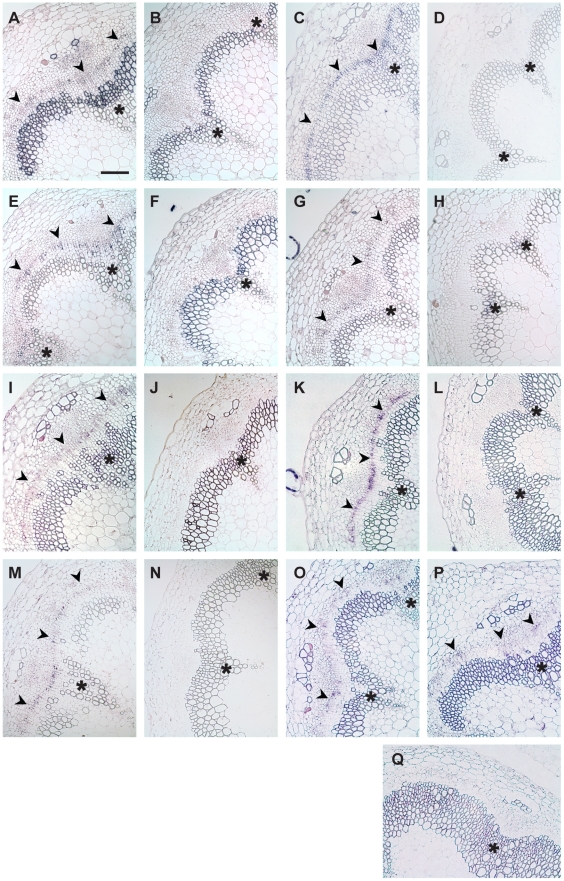
Cell-to-cell communication is crucial for the development of multicellular organisms, especially during the generation of new tissues and organs. Secondary growth--the lateral expansion of plant growth axes--is a highly dynamic process that depends on the activity of the cambium. The cambium is a stem cell-like tissue whose activity is responsible for wood production and, thus, for the establishment of extended shoot and root systems. Attempts to study cambium regulation at the molecular level have been hampered by the limitations of performing genetic analyses in trees and by the difficulty of accessing this tissue in model systems such as Arabidopsis thaliana. Here, we describe the roles of two receptor-like kinases, REDUCED IN LATERAL GROWTH1 (RUL1) and MORE LATERAL GROWTH1 (MOL1), as opposing regulators of cambium activity. Their identification was facilitated by a novel in vitro system in which cambium formation is induced in isolated Arabidopsis stem fragments. By combining this system with laser capture microdissection, we characterized transcriptome remodeling in a tissue- and stage-specific manner and identified series of genes induced during different phases of cambium formation. In summary, we provide a means for investigating cambium regulation in unprecedented depth and present two signaling components that control a process responsible for the accumulation of a large proportion of terrestrial biomass.


Conflict of interest statement

The authors have declared that no competing interests exist.

Figures

Figure 1
Figure 1. In vitro-induction of secondary growth (CIS–incubation).
(A and B) Comparison of cross-sections from a primary (A) and secondary (B) stem (IC: arrows in B). Blue: xylem/xylem fibers; red: fascicular and interfascicular cambium; yellow: phloem/phloem parenchyma; green: starch sheath. Triangle: see Figure 2H. (C) Origin of stem fragments for CIS-incubation. At the stage of collection, IC initiation was restricted to the region labeled in red . (D) Experimental setup of CIS. (E–G) Stem fragments incubated without (E) and with (F) apically applied NAA in comparison to a stem immediately above the uppermost rosette leaf of a 15 cm tall plant (G). Arrows indicate dividing tissues in interfascicular regions. (H and I). Fragments incubated with basally applied NAA (H) and with apically applied NAA together with ubiquitously applied NPA (I, 1 µg/ml). Size bar in (E): 100 µm, same magnification in (E–I). The positions of primary vascular bundles are labeled by asterisks.
Figure 2
Figure 2. Marker analysis during CIS–incubation and sampling strategy.
(A–E) The activity of the DR5rev:GFP reporter in CIS incubated stems (A–D) without NAA after 2 (A) or 5 days (B), and with apically applied NAA after 2 (C) or 5 days (D) in comparison to a fragment taken from the base of the inflorescence stem of an 18 cm tall plant (E). (F and G) APL:GUS detection in mock-treated (F) and NAA-treated (G) samples after 5 days of CIS-incubation. Signals in interfascicular regions are indicated by arrows. (H) Sampling strategy by LCM as also indicated in Figure 1A. Size bars in (A,F): 100 µm, same magnification in (A–E) and (F–G). The positions of primary vascular bundles are labeled by asterisks.
Figure 3
Figure 3. Expression of identified genes in various tissues.
(A) Average of mean array signal intensity (MSI) relations as described for genes present in Groups 1 and 2 comparing xylem (X), phloem/cambium (PC) and non-vascular (NV) tissues from hypocotyls. (B) Percentage of genes classified as being specifically expressed in WUS, FIL or CLV3 expression domains (Supplementary Table 5 in [37]) comparing ‘all’ genes present in the genome, genes found in Group 1, and in Group 2, respectively. (C and D) Radial (C) and longitudinal (D) distribution of expression levels of genes from Group 1 and 2 in root meristems based on the values for the top 50% of varying probe sets described in Supplementary Table 12 in . Average expression levels of genes listed in Table S2 (Group 1) and listed in Table S3 (Group 2) are shown. In (C), domains are defined by the expression of GFP marker lines. For (D), roots were dissected at different longitudinal positions resulting in samples representing subsequent developmental stages (see for details). Sample 1 contains the quiescent center and tissue-specific stem cells. CC  =  companion cells.
Figure 4
Figure 4. Transcript detection by RISH using antisense and sense probes.
(A and B) AT5G05160/RUL1, (C and D) PXY, (E and F) ATHB8, (G and H) AT5G51350/MOL1, (I and J) AGO4, (K and L) AT5G57130, (M and N) WOX4, (O) SCM (GUS probe), (P) ACA8 (GUS probe), (Q) GUS sense probe on ACA8:GUS line. (A, C, E, G, I, K, M, O, P) show results using antisense probes, (B, D, F, H, J, L, N, Q) using sense probes. Arrowheads indicate cambium-specific mRNA accumulation and asterisks label the position of primary vascular bundles. Stem sections come from immediately above the uppermost rosette leaf of 15 cm tall plants. Size bar in (A): 100 µm, same magnification in (A–Q).
Figure 5
Figure 5. Quantification of IC activity.
(A–C) Lateral extension of the IC together with the IC-derived tissue (ICD) in different genetic backgrounds at different positions along the shoot base. See Figure S5 for allele characterization. Significance levels are indicated by asterisks with the corresponding color. (D–I) Histological representations of mol1-1 (D), rul1-2 (E), and pxy-4 (F) mutants in comparison to corresponding wild-type plants (G, H, I). Brackets indicate the extension of the ICD. (J–O) Higher magnification of mol1-1 (J), rul1-2 (H), pxy-4 (N) mutants and the corresponding wild-type plants (K, M, O) as shown in (D–I). Size bar in (D) and (J): 50 µm, same magnification in (D–I) and in (J–O). Sections from immediately above the uppermost rosette leaf are shown (i.e. position 0 in A–C). Positions of primary vascular bundles are labeled by asterisks in (E–I).
Figure 6
Figure 6. Characterization of RUL1, MOL1, and PXY expression.
(A–C) Detection of RUL1 (A), MOL1 (B) and PXY (C) transcripts by RISH on cross sections of vegetative shoot tips. Asterisks label the apical meristem, arrowheads the cambium-specific signals in leaf bundles. Size bar in (A): 100 µm, same magnification in (A–C). (D) qRT-PCR-based analysis of transcript accumulation in the bottom-most centimeter of the stem and a fragment 3 cm further apically (compare Figure 1C). (E) qRT-PCR-based analysis of RUL1, MOL1, PXY, and WOX4 mRNA abundance in the first internode above the rosette of the corresponding mutants. (F) Genetic interaction between MOL1 and RUL1. Lateral extension of the ICD immediately above the uppermost rosette leaf is shown. (G) Unrooted tree for RUL1, MOL1, and PXY protein sequences, and their closest homologs from Populus trichocarpa based on full length protein sequences. There are two homologs each for MOL1 and PXY with a similar degree of sequence similarity. For RUL1, the situation is less straightforward as another Arabidopsis protein (AT5G58300) belongs to the same sub-clade partly displaying low bootstrap values. The scale bar represents 0.1 amino acid substitutions per position. Bootstrap values are given in percentage.

References

    1. Atta R, Laurens L, Boucheron-Dubuisson E, Guivarc'h A, Carnero E, et al. Pluripotency of Arabidopsis xylem pericycle underlies shoot regeneration from root and hypocotyl explants grown in vitro. Plant J. 2009;57:626–644. - PubMed
    1. Che P, Lall S, Nettleton D, Howell SH. Gene expression programs during shoot, root, and callus development in Arabidopsis tissue culture. Plant Physiol. 2006;141:620–637. - PMC - PubMed
    1. Greb T, Clarenz O, Schäfer E, Müller D, Herrero R, et al. Molecular analysis of the LATERAL SUPPRESSOR gene in Arabidopsis reveals a conserved control mechanism for axillary meristem formation. Genes Dev. 2003;17:1175–1187. - PMC - PubMed
    1. Sehr EM, Agusti J, Lehner R, Farmer EE, Schwarz M, et al. Analysis of secondary growth in the Arabidopsis shoot reveals a positive role of jasmonate signalling in cambium formation. Plant J. 2010;63:811–822. - PMC - PubMed
    1. Du J, Groover A. Transcriptional regulation of secondary growth and wood formation. J Integr Plant Biol. 2010;52:17–27. - PubMed

Publication types

MeSH terms