. 2011 Mar 10;69(5):893-905.
doi: 10.1016/j.neuron.2011.01.023.

The cerebrospinal fluid provides a proliferative niche for neural progenitor cells

Affiliations

The cerebrospinal fluid provides a proliferative niche for neural progenitor cells

Maria K Lehtinen et al. Neuron. .

Abstract

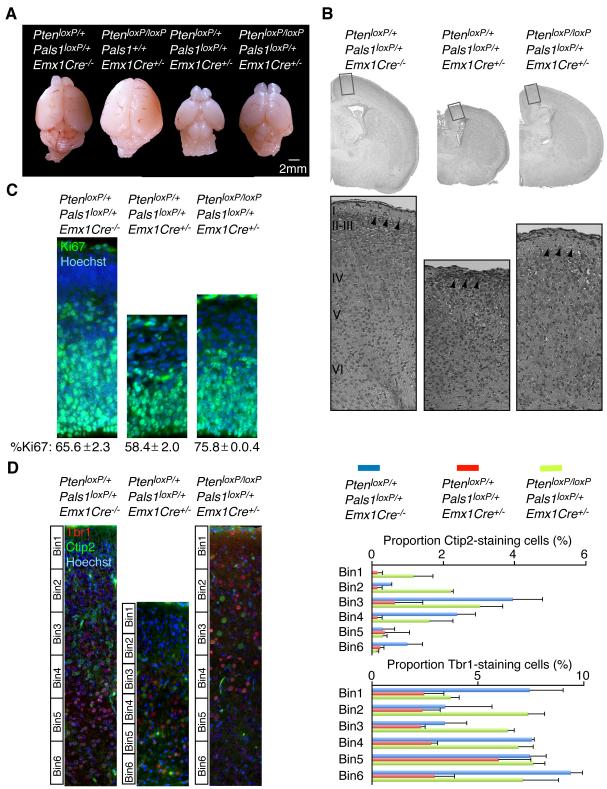
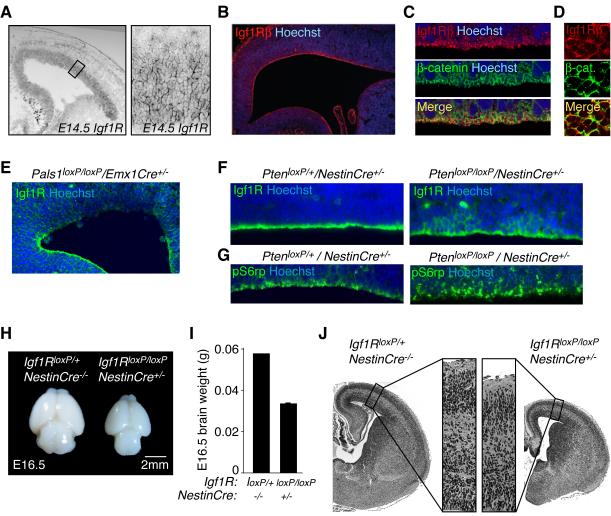
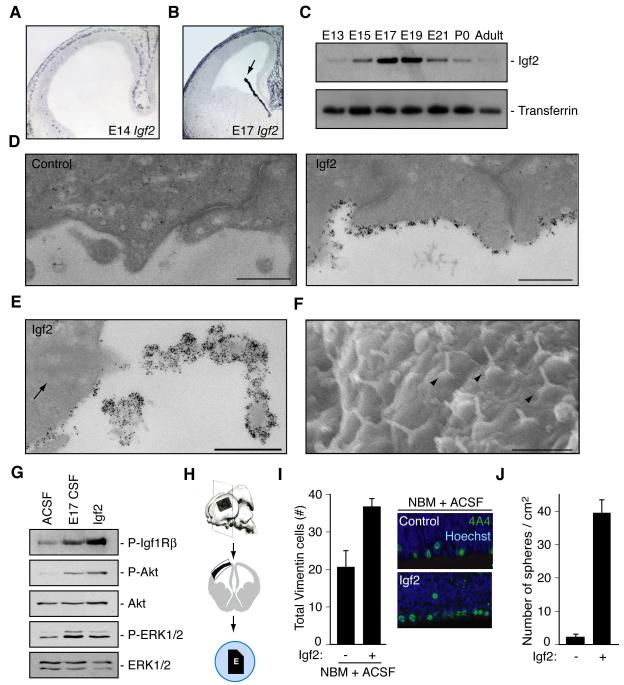
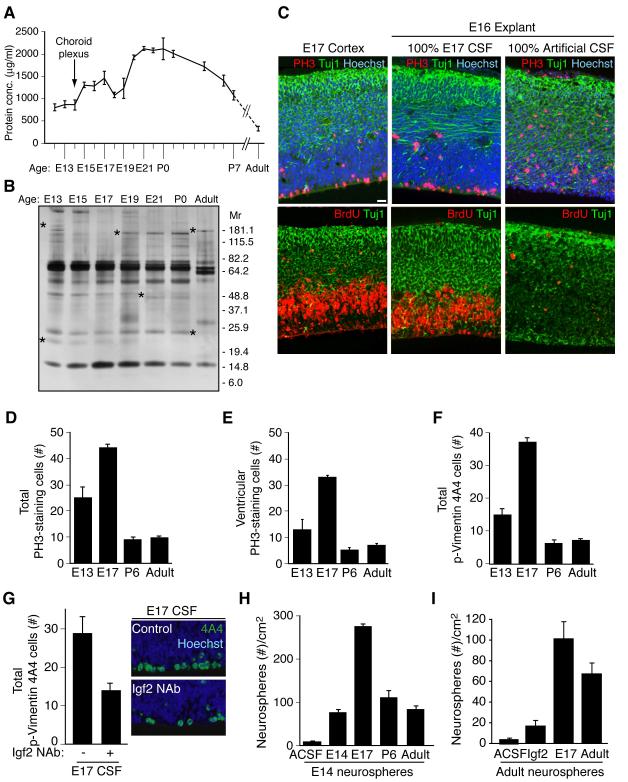
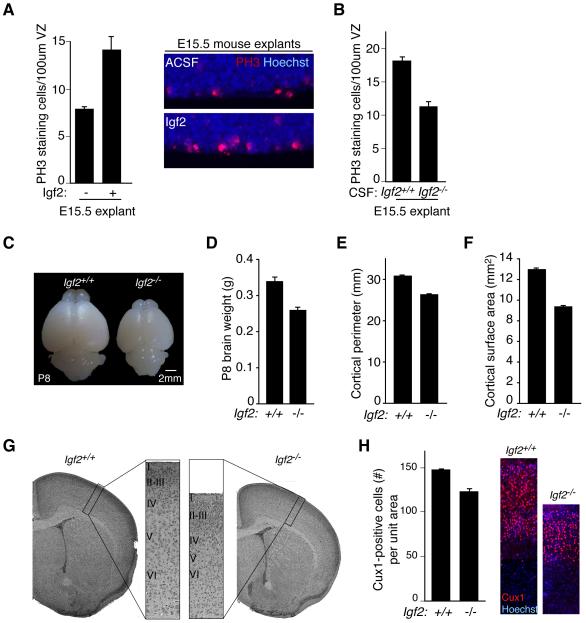
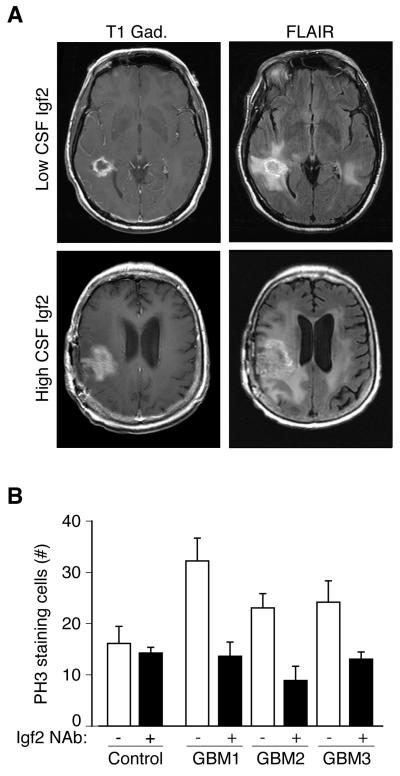
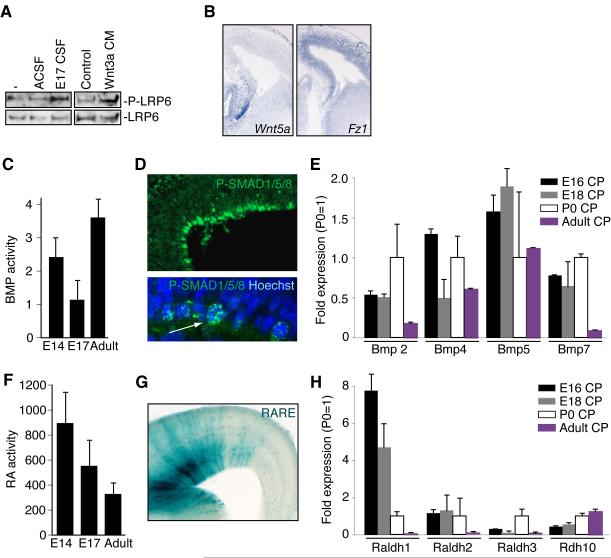
Cortical development depends on the active integration of cell-autonomous and extrinsic cues, but the coordination of these processes is poorly understood. Here, we show that the apical complex protein Pals1 and Pten have opposing roles in localizing the Igf1R to the apical, ventricular domain of cerebral cortical progenitor cells. We found that the cerebrospinal fluid (CSF), which contacts this apical domain, has an age-dependent effect on proliferation, much of which is attributable to Igf2, but that CSF contains other signaling activities as well. CSF samples from patients with glioblastoma multiforme show elevated Igf2 and stimulate stem cell proliferation in an Igf2-dependent manner. Together, our findings demonstrate that the apical complex couples intrinsic and extrinsic signaling, enabling progenitors to sense and respond appropriately to diffusible CSF-borne signals distributed widely throughout the brain. The temporal control of CSF composition may have critical relevance to normal development and neuropathological conditions.


Figures

Figure 1
Figure 1. The apical complex and Pten modulate brain size
(A) Conditional Pten deletion (PtenloxP/loxP/Emx1Cre+/−) resulted in hyperplagia and an enlarged cerebral cortex. Ablation of Pten in PtenloxP/loxP/Pals1loxP/+/Emx1Cre+/− mice largely restored the small brain phenotype of Pals1loxP/+/Emx1Cre+/− neonates. (B) H&E staining of PtenloxP/+/Pals1loxP/+/Emx1Cre−/−, PtenloxP/+/Pals1loxP/+/Emx1Cre+/−, and PtenloxP/loxP/Pals1loxP/+/Emx1Cre+/− neonates. Arrowheads point to marginal zone. (C) The proportion of Ki67-positive staining progenitors was restored in the E14.5 PtenloxP/loxP/Pals1loxP/+/Emx1Cre+/− cortex compared to PtenloxP/+/Pals1loxP/+/Emx1Cre+/− (Percent Ki67-positive staining cells ± S.E.M.; PtenloxP/+/Pals1loxP/+/Emx1Cre−/−: 65.6 ± 2.3; PtenloxP/+/Pals1loxP/+/Emx1Cre+/−: 58.4 ± 2.0; PtenloxP/loxP/Pals1loxP/+/Emx1Cre+/−: 75.8 ± 0.4; ANOVA, p<0.01, n=3). (D) Left panels: Representative images of Ctip2-positive and Tbr1-positive staining neurons analyzed in PtenloxP/+/Pals1loxP/+/Emx1Cre−/−, PtenloxP/+/Pals1loxP/+/Emx1Cre+/−, and PtenloxP/loxP/Pals1loxP/+/Emx1Cre+/− neonates. Right panels: The cortical plate was subdivided into six equal bins and Ctip2 and Tbr1 positive cells quantified per bin are expressed as percent of total cells per bin. Pten deletion in the PtenloxP/loxP/Pals1loxP/+/Emx1Cre+/− mice restored the proportions of early-born cells marked by Tbr1 and Ctip2 (Percent positive staining cells/total: PtenloxP/+/Pals1loxP/+/Emx1Cre−/− Ctip2 = 8.13 ± 2.0, Tbr1 = 38.7 ± 2.4; PtenloxP/+/Pals1loxP/+/Emx1Cre+/− Ctip2 = 1.6 ± 1.2, Tbr1 = 18.8 ± 3.1; PtenloxP/loxP/Pals1loxP/+/Emx1Cre+/− Ctip2 = 8.5 ± 1.6, Tbr1 = 39.1 ± 2.6; ANOVA, p<0.05, n = 3). See also Figure S1.
Figure 2
Figure 2. Igf1R expression in cortical progenitor cells
(A) Left panel: Igf1R in situ hybridization at E14.5 mouse. Right panel: High magnification image of area denoted in left panel. (B) Igf1R enriched along the ventricular surface of E17 rat cortex. (C) Confocal images of Igf1Rβ and β-catenin immunostaining in rat E17 ventricular zone. (D) En face view of the mouse E16.5 ventricular zone immunostained with Igf1Rβ and β-catenin. (E) Ventricular Igf1R expression was disrupted in E12.5 Pals1loxP/loxP/Emx1Cre+/− cortex. (F) Left panel: Igf1R expression was enriched along the apical, ventricular zone of E14.5 PtenloxP/+/NestinCre+/− controls. Right panel: Igf1R expression expanded basolaterally in PtenloxP/loxP/NestinCre+/− radial glia. (G) Left panel: pS6rp activity along the ventricular progenitors of E14.5 PtenloxP/+/NestinCre+/− controls. Right panel: pS6rp localization extended basolaterally in PtenloxP/loxP/NestinCre+/− radial glia. See also Figure S1. (H) Igf1R deficiency in NestinCre expressing cells diminished brain size at E16.5. (I) Brain weights of Igf1RloxP/loxP/NestinCre+/− and controls at E16.5 (brain weight (g) ± S.E.M.: Igf1RloxP/loxP/NestinCre+/−: 0.06; Igf1RloxP/loxP/NestinCre+/−: 0.03 ± 0.001; n = 2 [+/+], n = 3 [−/−]). (J) H&E staining of brains shown in panel (I).
Figure 3
Figure 3. Igf2 is expressed in cerebrospinal fluid and stimulates progenitor proliferation
(A, B) Igf2 in situ hybridization of rat E14 and E17 cortex. Arrow points to choroid plexus. (C) Transient Igf2 expression in rat CSF. (D) Immunogold labeling of endogenous Igf2 in E17 rat brain. Left panel: no primary control. Right panel: Igf2 binding to ventricular surface of cortical progenitors. Scale bar represents 500nm. (E) Igf2 binding to primary cilium of cortical progenitor cell. Arrow points to ciliary basal body. Scale bar represents 500nm. (F) Scanning EM of mouse ventricular surface at E12.5. Arrowheads point to primary cilia projecting into the ventricular space. Scale bar represents 2μm. (G) Lysates of cortical cells deprived of growth factors for 6 hours and treated with ACSF, E17 CSF, or Igf2 for 5 minutes were immunoblotted with antibodies to P-Igf1R, P-Akt, Akt, P-ERK1/2, and ERK1/2. (H) Schematic of cortical explant dissections: explant placed on membrane with ventricular side down contacting CSF and notch making medial-caudal side. (I) Left panels: E16 explants cultured with NBM plus ACSF (control) or with supplemental Igf2 immunostained with anti-Vimentin 4A4 and Hoechst represented as mean ± SEM (Igf2 mean: 36.7 ± 2.1; control mean: 20.4 ± 4.46; n = 8; Mann-Whitney; p<0.005). Vimentin 4A4-positive cells increased in explants cultured with Igf2 compared to control. Right panels: Representative images of explants quantified in left panels. (J) Single cells dissociated from primary neurospheres cultured in control media or control media containing Igf2 (20ng/ml). Igf2 stimulated secondary sphere formation after 10 DIV (Igf2 mean: 39.3 ± 4.1; control mean: 2.2 ± 0.75; n = 3; t-test; p<0.005).
Figure 4
Figure 4. Embryonic CSF supports cortical explant viability and stimulates proliferation of neural progenitor cells
(A) Total CSF protein concentration over rat development. (B) Silver stain of embryonic rat CSF revealed a dynamic fluid with numerous changes in protein composition over time. Asterisks indicate proteins with varying CSF expression during development. (C) E17 rat cortex and E16 explants grown for 24 hours in 100% embryonic E17 CSF or 100% artificial CSF respectively. Upper panels: anti-PH3 (red), and anti-Tuj1 (green), Hoechst (blue) immunostaining. Lower panels: anti-BrdU (red), and anti-Tuj1 (green) immunostaining. Explants cultured in 100% E17 CSF in vitro maintained tissue histology similar to embryo in vivo. Survival and proliferation of explants cultured with E17 CSF indicated by immunoreactivity for PH3 along the ventricular surface, BrdU incorporation in the ventricular zone, and Tuj1-positive-staining neurons in the developing cortical plate. (D) E16 explants cultured in 100% E13, E17, P6, or adult CSF for 24 hours were immunostained with anti-PH3 (red) and Hoechst (blue)(see Figure S2C). Quantification of total PH3-positive-staining cells per 400μm explant showed that proliferating cells increased in explants cultured with E17 CSF compared to E13, P6, or adult CSF. Immuno-positive cells are represented as mean ± SEM (E17 mean: 44.1 ± 1.43; E13 mean: 25 ± 4.2; P6 mean: 9.2 ± 0.8; adult mean: 9.6 ± 0.9, n = 4; Kruskal-Wallis; p<0.005). (E) Quantification of ventricular PH3-staining cells in explants (panel D). PH3-positive cells along the ventricle were significantly increased in explants cultured with E17 CSF compared to E13, P6, or adult CSF (E17 mean: 32.3 ± 0.79; E13 mean: 12.8 ± 3.9; P6 mean: 4.9 ± 1.0; adult mean: 6.9 ± 0.73; n = 4; Kruskal-Wallis; p<0.01). (F) E16 explants (panel D) immunostained with anti-Vimentin 4A4 (green)(see Figure S2C) were quantified. Vimentin 4A4-positive cells were significantly increased in explants cultured with E17 CSF compared to E13, P6, or adult CSF (E17 mean: 37.1 ± 1.4; E13 mean: 14.9 ± 1.9; P6 mean: 6.1 ± 1.05; adult mean: 7.3 ± 0.6; n = 4; Kruskal-Wallis; p<0.005). (G) Left panels: E16 explants cultured in control E17 CSF or E17 CSF with Igf2 neutralizing antibody (Igf2 NAb), immunostained with anti-Vimentin 4A4 and Hoechst (E17 control mean: 28.8 ± 4.3; E17 IGF2 NAb mean: 13.9 ± 2.0; n = 4; Mann-Whitney; p<0.05). Vimentin 4A4-positive cells decreased in explants cultured with E17 CSF plus Igf2 NAb compared to control. Right panels: Representative images of explants quantified in left panels. (H) Primary neurospheres derived from E14.5 cortex were grown in 20% E13/E14, E17, P6, or adult CSF for 10 days in vitro (DIV). E17 CSF generated the most spheres/cm2 (E17 mean: 274 ± 8.0; E13 mean: 77 ± 7.0; P6 mean: 110 ± 17.5; adult mean: 81 ± 8.8; n = 3; ANOVA; p<0.005). See also Figure S2. (I) Neurospheres derived from adult rat SVZ were cultured in artificial (A)CSF, Igf2 (20ng/ml), E17 CSF, or adult rat CSF for 10DIV. Igf2, E17 CSF, and adult CSF supported the growth and maintenance of adult neurospheres (ACSF: 4.76 ± 0.67; Igf2: 17.3 ± 3.2; E17 CSF: 101.7 ± 15.8; Adult CSF: 67.8 ± 12.6; Kruskal-Wallis: Igf2 vs. E17 CSF, p<0.05; E17 CSF vs. Adult CSF, N.S.; n=3). See also Figure S2.
Figure 5
Figure 5. CSF Igf2 regulates progenitor proliferation and brain size
(A) Left panels: E15.5 C57BL/6 explants cultured in NBM supplemented with 20% ACSF or ACSF/Igf2. Igf2 stimulated the proliferation of PH3-positive cortical progenitor cells (C57BL/6 explants: ACSF mean: 7.4 ± 0.2; E16.5 mean: 14.1 ± 1.4; Igf2 mean: 11.2 ± 0.3; Kruskal-Wallis; E16.5 vs. ACSF, p<0.01; Igf2 vs. ACSF, p<0.05; E16.5 vs. Igf2, N.S.; n=3). Right panels: Representative images of explants quantified in left panels. (B) E15.5 C57BL/6 explants cultured in NBM supplemented with 20% ACSF or E16.5 Igf2−/− CSF. Igf2-deficient CSF failed to stimulate progenitor cell proliferation compared to control (ACSF: 17.9 ± 0.8; Igf2−/− CSF: 11.4 ± 1.0; Mann-Whitney; p<0.06; n=3 and n=4, respectively). (C) Representative images of P8 Igf2−/− and control brains. (D) Igf2-deficiency reduced P8 brain weight (Igf2+/+: 0.34g ± 0.008; Igf2−/−: 0.26g ± 0.004; Mann-Whitney, p<0.0001, n=11). (E) Igf2-deficiency reduced P8 cortical perimeter (Igf2+/+: 30.9mm ± 0.01; Igf2−/−: 26.4mm ± 0.1; Mann-Whitney, p<0.0001, n=11). (F) Igf2-deficiency reduced P8 cortical surface area (Igf2+/+: 13.0mm2 ± 0.1; Igf2−/−: 9.4mm2 ± 0.1; Mann-Whitney, p<0.0001, n=11). (G) H&E staining of Igf2−/− and control brains at P8. (H) Left panels: Igf2−/− brains have reduced numbers of upper layer neurons marked by Cux1 (Total Cux1-positive staining cells in equally sized cortical columns expressed as mean ± S.E.M.: Igf2+/+: 157 ± 1.5; Igf2−/−: 131.3 ± 3.3; t-test, p<0.005, n=3). Right panels: Representative images of Igf2−/− and control brains quantified in left panels. See also Figure S3.
Figure 6
Figure 6. Glioblastoma CSF Igf2 supports progenitor proliferation
(A) MRI scans from subjects with low and high CSF Igf2 levels. Gadolinium-enhanced T1-weighted (T1-Gad) MRI sequence delineated the contrast-enhanced portion of the tumor where tumor angiogenesis developed. Fluid attenuation inversion recovery (FLAIR) images included area of non-vascularized and invasive tumor (Macdonald et al., 1990). (B) 20% human GBM CSF in NBM stimulated PH3-positive proliferating cells compared to an average of 3 disease-free control CSFs in E16 rat explants (control = 16.0 ± 4.1 (n=3); GBM1 = 32.3 ± 4.3 (n=4); GBM2 = 23.0 ± 2.8 (n=5); GBM3 = 23.4 ± 3.8 (n=4); Mann-Whitney, p<0.05). Igf2(NAb) inhibited GBM CSF-stimulated progenitor proliferation (GBM1 = 13.5 ± 2.9 (n=4); GBM2 = 9.0 ± 2.7 (n=4); GBM3 = 13.0 ± 1.5 (n=3); Mann-Whitney, p<0.05). CSF Igf2 concentration before and after Igf2 NAb absorption: GBM1(PBS) = 605.8ng/ml; GBM1(NAb) = 45.6ng/ml; GBM2(PBS) = 502.8ng/ml; GBM2(NAb) = 218.3ng/ml; GBM3(PBS) = 468.7ng/ml; GBM3(NAb) = 248.8ng/ml).
Figure 7
Figure 7. The CSF proteome coordinates multiple signaling pathways that regulate brain development
(A) Lysates of cortical cells were left untreated or treated with 20% ACSF or E17 CSF and 10% Wnt3a conditioned medium or its control medium for 2 hours and subjected to immunoblotting with the P-LRP6 or LRP antibodies. (B) In situ hybridization for Wnt5a and Fz1 in mouse E14.5 cortex. (C) Bmp activity was measured in E14, E17, and adult rat CSF as luciferase signal in a clonally derived Bmp-sensitive cell line. Responses were compared to linear responses generated in the same cell line by pure ligand (Bmp4; data not shown). Bmp activity levels varied with age, and were statistically significant between E17 and adult (ANOVA, p<0.001; n=4). (D) Top panel: Expression and nuclear localization of phospho-Smad (P-SMAD) 1/5/8 in E14 rat cortical ventricular cells. Bottom panel: Arrow points to expression and nuclear localization of P-SMAD1/5/8 in E16.5 mouse cortical ventricular cells. (E) qPCR measurement of Bmps 2,4,5, and 7 in the E16, E18, P0, and adult rat choroid plexus (CP). (F) Quantification of RA activity in E14, E17, and adult rat CSF. RA activity declined, based on comparison of CSF activation of an RA responsive, clonally derived cell line with response to RA at known concentrations, from mid-gestation through adulthood (ANOVA, p=0.07; n=4). (G) RA responsive progenitor cells at the cortical ventricular zone from an E16.5 DR5-RARE transgenic mouse (LaMantia et al., 1993). (H) qPCR of Raldh1, 2, 3, and Adh10, in rat CP.

References

    1. Ayer-le Lievre C, Stahlbom PA, Sara VR. Expression of IGF-I and -II mRNA in the brain and craniofacial region of the rat fetus. Development. 1991;111:105–115. - PubMed
    1. Baker J, Liu JP, Robertson EJ, Efstratiadis A. Role of insulin-like growth factors in embryonic and postnatal growth. Cell. 1993;75:73–82. - PubMed
    1. Bendall SC, Stewart MH, Menendez P, George D, Vijayaragavan K, Werbowetski-Ogilvie T, Ramos-Mejia V, Rouleau A, Yang J, Bosse M, et al. IGF and FGF cooperatively establish the regulatory stem cell niche of pluripotent human cells in vitro. Nature. 2007;448:1015–1021. - PubMed
    1. Binoux M, Lassarre C, Gourmelen M. Specific assay for insulin-like growth factor (IGF) II using the IGF binding proteins extracted from human cerebrospinal fluid. J Clin Endocrinol Metab. 1986;63:1151–1155. - PubMed
    1. Bondy C, Werner H, Roberts CT, Jr., LeRoith D. Cellular pattern of type-I insulin-like growth factor receptor gene expression during maturation of the rat brain: comparison with insulin-like growth factors I and II. Neuroscience. 1992;46:909–923. - PubMed

Publication types

MeSH terms