. 2011 Mar 22;123(11):1216-26.
doi: 10.1161/CIRCULATIONAHA.110.985523. Epub 2011 Mar 7.

S100A9 differentially modifies phenotypic states of neutrophils, macrophages, and dendritic cells: implications for atherosclerosis and adipose tissue inflammation

Affiliations

S100A9 differentially modifies phenotypic states of neutrophils, macrophages, and dendritic cells: implications for atherosclerosis and adipose tissue inflammation

Michelle M Averill et al. Circulation. .

Abstract

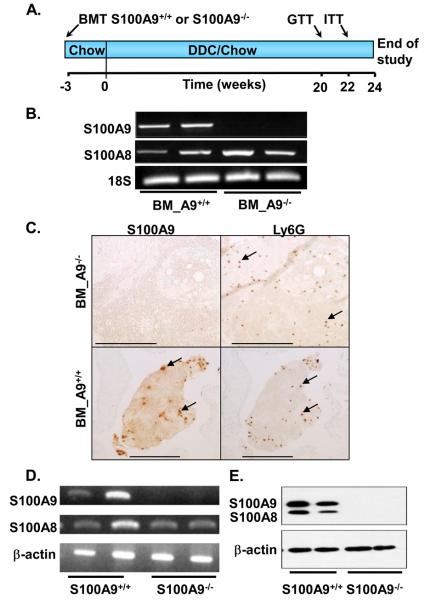
Background: S100A9 is constitutively expressed in neutrophils, dendritic cells, and monocytes; is associated with acute and chronic inflammatory conditions; and is implicated in obesity and cardiovascular disease in humans. Most of the constitutively secreted S100A9 is derived from myeloid cells. A recent report demonstrated that mice deficient in S100A9 exhibit reduced atherosclerosis compared with controls and suggested that this effect was due in large part to loss of S100A9 in bone marrow-derived cells.

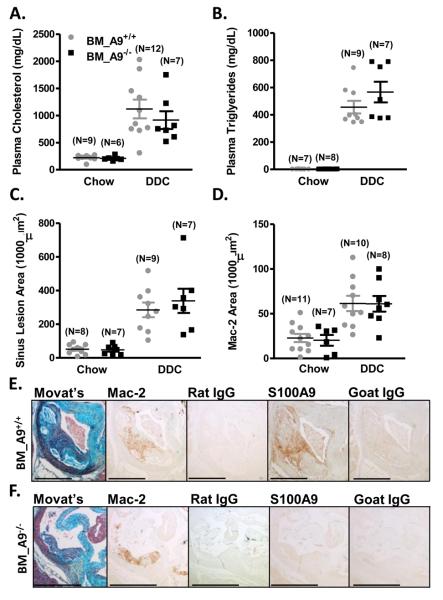
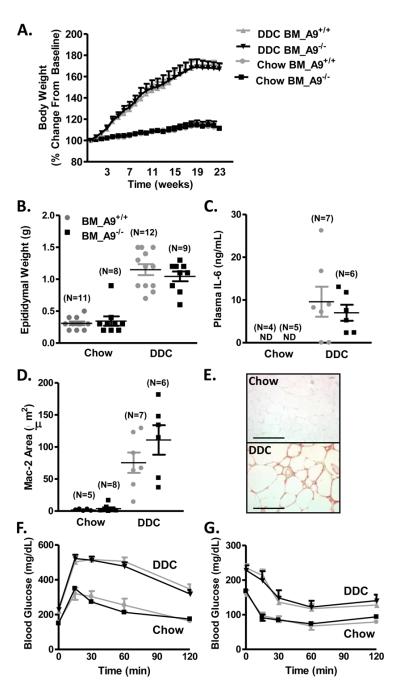
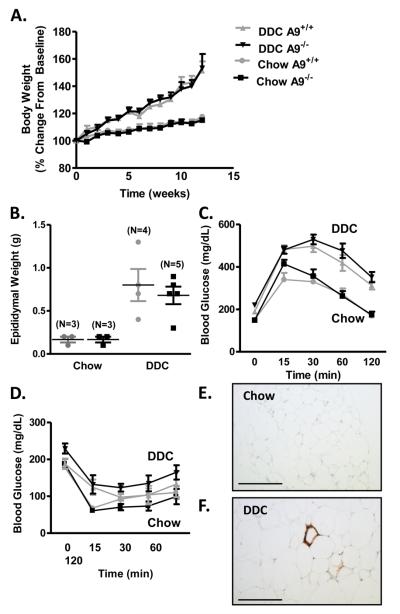
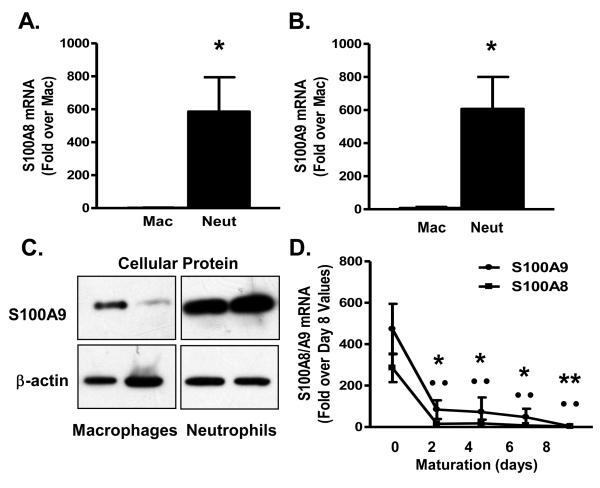
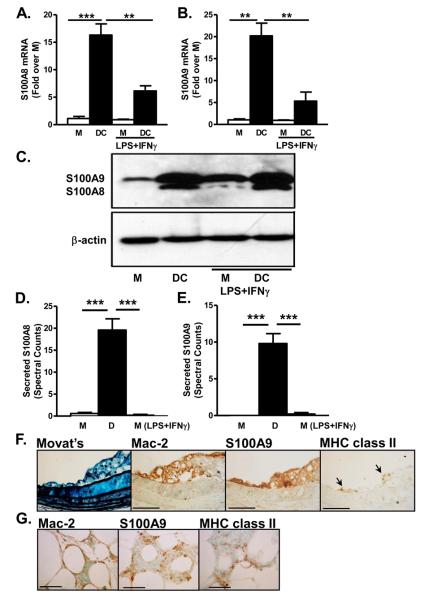
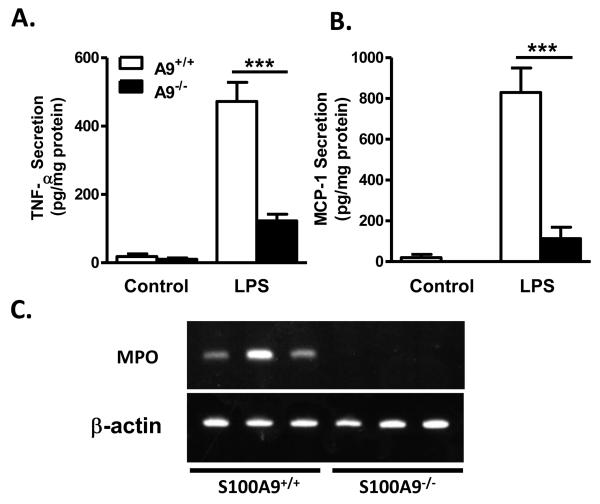
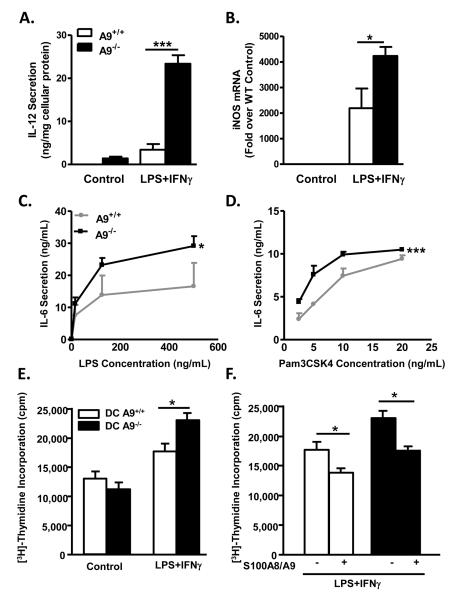
Methods and results: To directly investigate the role of bone marrow-derived S100A9 in atherosclerosis and insulin resistance in mice, low-density lipoprotein receptor-deficient, S100A9-deficient bone marrow chimeras were generated. Neither atherosclerosis nor insulin resistance was reduced in S100A9-deficient chimeras fed a diet rich in fat and carbohydrates. To investigate the reason for this lack of effect, myeloid cells were isolated from the peritoneal cavity or bone marrow. S100A9-deficient neutrophils exhibited a reduced secretion of cytokines in response to toll-like receptor-4 stimulation. In striking contrast, S100A9-deficient dendritic cells showed an exacerbated release of cytokines after toll-like receptor stimulation. Macrophages rapidly lost S100A9 expression during maturation; hence, S100A9 deficiency did not affect the inflammatory status of macrophages.

Conclusions: S100A9 differentially modifies phenotypic states of neutrophils, macrophages, and dendritic cells. The effect of S100A9 deficiency on atherosclerosis and other inflammatory diseases is therefore predicted to depend on the relative contribution of these cell types at different stages of disease progression. Furthermore, S100A9 expression in nonmyeloid cells is likely to contribute to atherosclerosis.


Figures

Figure 1
Figure 1. Bone marrow S100A9-deficiency results in loss of S100A9 in leukocytes
Irradiated male LDLR−/− mice received wild type (BM_A9+/+) or S100A9-deficient (BM_A9−/−) bone marrow. Three weeks later, some mice were switched to DDC, and maintained for 24 weeks (A). Blood was collected 27 weeks after transplant, erythrocytes were lysed, and leukocyte RNA was extracted. S100A8 and S100A9 mRNA was determined using semi-quantitative RT-PCR and normalized to 18S (B). Blood clots were stained for Ly6G (neutrophils) and S100A9 to determine chimerism (C). Representative S100A9-positive and Ly6G-positive cells are indicated by arrows; bars are 250 μm. Bone marrow cells were differentiated in 10 ng/mL GM-CSF for 5 days. S100A8 and S100A9 mRNA and protein levels were analyzed by semi-quantitative RT-PCR (D) and Western blot (E). The experiments were repeated several times with similar results.
Figure 2
Figure 2. Bone marrow S100A9-deficiency does not reduce atherosclerosis
Male LDLR−/− mice were transplanted with wild type (BM_A9+/+) or S100A9-deficient (BM_A9−/−) bone marrow and fed chow or DDC for 24 weeks. Plasma cholesterol (A) and triglycerides (B) were measured at the end of the study. Total aortic sinus lesion area (C) and Mac-2 positive area (D) was quantified. The results are presented as scatter plots, with mean ± SEM indicated by horizontal lines and vertical lines, respectively. Two-way ANOVA, followed by Bonferroni post-hoc tests, was used to evaluate the effect of diet (chow versus DDC) and genotype (BM_A9+/+ versus BM_A9−/−) on (A) plasma cholesterol (mg/dL), (B) plasma triglycerides (mg/dL), (C) sinus lesion area (1000 μm2), and (D) Mac-2-positive lesion area (1000 μm2). DDC-feeding significantly increased plasma cholesterol, plasma triglycerides, sinus lesion area, and Mac-2 area (all p<0.001 versus chow), but bone marrow S100A9-deficiency had no effect on any of these parameters (p>0.05). Representative BM_A9+/+ (E) and BM_A9−/− (F) aortic sinus sections were stained with a Movat's pentachrome method, anti-Mac-2, anti-Ly6G, anti-S100A9, or relevant negative control IgGs. Bar represents 500 μm
Figure 3
Figure 3. Bone marrow S100A9-deficiency does not affect insulin resistance
Male LDLR−/− mice were transplanted with wild-type (BM_A9+/+) or S100A9-deficient (BM_A9−/−) bone marrow, and fed chow or DDC for 24 weeks. Body weights were normalized to starting body weight (A). Two-way ANOVA was used to evaluate the effect of diet (chow versus DDC) over time (weeks) on body weight (% change from baseline), followed by Bonferroni post-hoc analysis to compare the effect of S100A9-deficiency (BM_A9+/+ versus BM_A9−/−). DDC-feeding significantly increased body weight (p<0.001) compared to chow-feeding in both BM_A9+/+ and BM_A9−/− mice, but there were no differences between BM_A9+/+ mice and BM_A9−/− mice fed chow or DDC (p>0.05). N=6 chow-fed BM_A9+/+ mice; N=6 chow-fed BM_A9−/−; N=12 DDC-fed BM_A9+/+; N=9 DDC-fed BM_A9−/− mice. Epididymal fat pad weight (B). Twoway ANOVA was used to evaluate the effect of diet (chow versus DDC) and genotype (BM_A9+/+ versus BM_A9−/− mice) on epididymal weight (g), followed by Bonferroni post-hoc analysis. DDC-feeding significantly increased epididymal weight (p<0.001), but bone marrow S100A9-deficiency had no effect (p>0.05). Plasma IL-6 was measured by ELISA (C). Statistical analysis was performed using unpaired two-tailed Student's t-test on IL-6 levels (ng/mL) in DDC-fed mice. Bone marrow S100A9-deficiency had no effect (p>0.05). Mac-2-positive area was quantified in 3 epididymal fat sections/animal (D). Two-way ANOVA was used to evaluate the effect of diet (chow versus DDC) and genotype (BM_A9+/+ versus BM_A9−/− mice) on Mac-2 area (μm2), followed by Bonferroni post-hoc analysis. DDC-feeding significantly increased Mac-2 area (p<0.001), but bone marrow S100A9-deficiency had no effect (p>0.05). Representative sections of anti-Mac-2 stained epididymal sections (E). GTT (F) and ITT (G) were conducted after 20 and 22 weeks on diet, respectively. Two-way ANOVA was used to evaluate the effect of diet (chow versus DDC) as a function of area under the curve on blood glucose (mg/dL), followed by Bonferroni post-hoc analysis. DDC-feeding significantly increased the area under the curve for both ITT and GTT (both p<0.001), but bone marrow S100A9-deficiency had no effect (p>0.05). N=11 chow-fed BM_A9+/+ mice; N=11 chow-fed BM_A9−/−; N=14 DDC-fed BM_A9+/+; N=14 DDC-fed BM_A9−/− mice. The results are presented as mean + SEM, (A, F, G) or as scatter plots, with mean ± SEM indicated by horizontal lines and vertical lines, respectively (B-D). Bar, 200 μm in E; ND, non-detectable
Figure 4
Figure 4. Whole-body S100A8/A9 deficiency does not improve insulin resistance
Whole-body S100A9+/+ (A9+/+) and S100A9−/− (A9−/−) male mice were fed chow or DDC for 12 weeks. Body weights were normalized to starting body weight (A). Two-way ANOVA was used to evaluate the effect of diet (chow versus DDC) on body weight (% change from baseline) as a function of time (weeks), followed by Bonferroni post-hoc analysis. DDC-feeding significantly increased body weight (p<0.001) in A9+/+ and A9−/− mice, but S100A9-deficiency had no effect (p>0.05). N=3 chow-fed A9+/+ mice; N=3 chow-fed A9−/−; N=4 DDC-fed A9+/+; N=7 DDC-fed A9−/− mice. Epididymal fat pad weight was measured (B). Two-way ANOVA was used to evaluate the effect of diet (chow versus DDC) on epididymal weight (g), followed by Bonferroni post-hoc analysis. DDC-feeding significantly increased epididymal weight (p<0.001), but bone marrow S100A9-deficiency had no effect (p>0.05). GTT (C) and ITT (D) were conducted after 10 and 12 weeks on diet, respectively. Two-way ANOVA was used to evaluate the effect of diet (chow versus DDC) as a function of time (min) on blood glucose (mg/dL), followed by Bonferroni post-hoc analysis. DDC-feeding significantly increased area under the curve from the GTT (p<0.001), but S100A9-deficiency had no effect (p>0.05). DDC-feeding did not significantly increase area under the curve for ITT (p>0.05), nor was there an effect of S100A9-deficiency. N=3 chow-fed A9+/+ mice; N=3 chow-fed A9−/−; N=4 DDC-fed A9+/+; N=4 (C) or N=7 (D) DDC-fed A9−/− mice. The results are presented as mean + or ± SEM (A, C-D), or as scatter plots, with mean ± SEM indicated by horizontal lines and vertical lines, respectively (B). Representative Mac-2-stained epididymal sections from chow-fed (E) and DDC-fed (F) S100A9+/+ mice. Bar, 200 μm in E-F
Figure 5
Figure 5. Neutrophils and monocytes express more S100A8 and S100A9 than macrophages
Thioglycollate-elicited neutrophils and macrophages were obtained from C57BL/6 mice. S100A8 (A, N=6) and S100A9 (B, N=6) mRNA levels were measured by real-time PCR. Cellular S100A9 protein and β-actin levels were measured in macrophages and neutrophils. Statistical analysis to compare levels in macrophages and neutrophils was performed by unpaired Student's t-test (*p<0.05). A representative Western blot is shown; images are from the same blot (C). Bone marrow from C57BL/6 mice was collected and enriched for monocytes. Monocytes were cultured in 30% L-conditioned medium. S100A8 and S100A9 mRNA was expressed relative to day 8 (D, N=3). One-way ANOVA was used to evaluate S100A9 and S100A8 mRNA as a function of time (days), followed by Tukey posthoc test (*p<0.05, **p<0.01 for S100A9 mRNA versus S100A9 mRNA day 0; ··p<0.01 for S100A8 mRNA versus S100A8 mRNA at day 0). The results are presented as mean + or ± SEM (A-B, D). Mac, macrophages; Neut, neutrophils
Figure 6
Figure 6. Dendritic cells express and secrete more S100A8 and S100A9 than macrophages
Bone marrow-derived macrophages or DCs were cultured in L-conditioned medium as a source of M-CSF (macrophages) or GM-CSF (DCs). Some cells were stimulated with LPS plus IFNγ during the last 24 h. S100A8 (A; N=3) and S100A9 (B; N=3) mRNA levels were measured by real-time-PCR. Cells from the same mice were used in (A) and (B). Statistical analysis was performed by repeated measures one-way ANOVA for S100A8 and S100A9 mRNA (fold over M), followed by Tukey posthoc test. M versus DC ***p<0.001 in (A) and **p<0.01 in (B); DC versus M LPS+IFNγ ***p<0.001; DC versus DC LPS+IFNγ **p<0.01. Other comparisons; p>0.05. Cellular S100A8, S100A9, and #$actin levels were evaluated by Western blot (C). (D-E) Macrophages were differentiated for 7 days followed by LPS+IFNγ activation for 24 h. DCs were cultured for 9 days. Conditioned media were collected, and secreted S100A8 (D; N=5) and S100A9 (E; N=5) was analyzed by tandem mass-spectrometry. Statistical analysis was performed by one-way ANOVA for secreted S100A8 and S100A9 (spectral counts) followed by Tukey posthoc test. M versus DC ***p<0.001; DC versus M LPS+IFNγ ***p<0.001. Other comparisons; p>0.05. The results are presented as mean + SEM (A-B, D-E). (F) BCA representative adjacent sections of atherosclerotic lesions from LDLR−/− mice stained with Movat's pentachrome stain, anti-Mac-2, anti-S100A9, and anti-MHC class II (F). Epididymal adipose tissue from male LDLR−/− mice fed DDC for 24 weeks (G). Representative sections of anti-Mac-2, anti-S100A9, and anti-MHC class II stained tissue from the same animal are shown. Lines indicate 100 μm in F and 50 μm in G. M, macrophage; D, dendritic cell
Figure 7
Figure 7. S100A9 -deficient neutrophils secrete less TNF-α and MCP-1
Thioglycollate-elicited peritoneal neutrophils were obtained from S100A9+/+ and S100A9−/− mice, and stimulated with 250 ng/mL LPS overnight. TNF-α (A) and MCP-1 (B) were measured in conditioned media by ELISA. The results are presented as mean + SEM (A-B). Statistical analysis was performed by one-way ANOVA for TNF-α and MCP-1 secretion (pg/mg protein) followed by Tukey posthoc test. A9+/+ and A9−/− control versus A9+/+ LPS ***p<0.001; A9+/+ LPS versus A9−/− LPS ***p<0.001. Other comparisons; p>0.05. N=3 except for LPS-stimulated cells in (A; N=4). (C) Epididymal adipose tissue harvested from three S100A9+/+ and S100A9−/− mice after a 2-week regimen on DDC. Levels of MPO mRNA were evaluated by RT-PCR in each mouse.
Figure 8
Figure 8. S100A9-deficient DCs display increased pro-inflammatory properties
Bone marrow-derived DCs from S100A9+/+ or S100A9−/− mice were activated with LPS and IFNγ. Secreted IL-12p40 was measured by ELISA (A) and iNOS mRNA was measured with real-time PCR (B). Statistical analysis was performed by oneway ANOVA for IL-12 secretion (ng/mg cellular protein) or iNOS mRNA (fold over wildtype control), followed by Tukey posthoc test. In (A), A9−/− control cells versus A9−/− LPS-stimulated cells, and A9−/− LPS-stimulated cells versus A9+/+ control cells or A9+/+ LPS-stimulated cells ***p<0.001. In (B), A9−/− and A9+/+ control cells versus A9−/− LPS-stimulated cells, A9+/+ control cells versus A9+/+ LPS-stimulated cells, and A9+/+ LPS-stimulated cells versus A9−/− control cells or A9−/− LPS-stimulated cells *p<0.05. Other comparisons; p>0.05. CD11c+-purified DCs were stimulated with LPS (C) or Pam3CSK4 (D). IL-6 secretion was measured by ELISA. Two-way ANOVA was used to evaluate the effect of S100A9-deficiency on IL-6 secretion (ng/mL) as a function of LPS and Pam3CSK4 concentration (ng/mL). LPS and Pam3CSK4 significantly increased IL-6 secretion (p<0.001). S100A9-deficiency significantly increased IL-6 secretion in response to LPS compared to wildtype controls (*p<0.05) and Pam3CSK4 (***p<0.01). CD4+/CD8+ T lymphocytes from BALB/c mice were mixed with control DCs and stimulated DCs obtained from S100A9+/+ and S100A9−/− mice in the absence (E) or presence (F) of 10 mg/mL exogenous S100A8/A9. T-cell proliferation was estimated by [3H]-thymidine incorporation. Statistical analysis was performed by unpaired Student's t-test between the groups indicated by lines (*p<0.05). The results are presented as mean + SEM; N=3.

References

    1. Healy AM, Pickard MD, Pradhan AD, Wang Y, Chen Z, Croce K, Sakuma M, Shi C, Zago AC, Garasic J, Damokosh AI, Dowie TL, Poisson L, Lillie J, Libby P, Ridker PM, Simon DI. Platelet expression profiling and clinical validation of myeloid-related protein-14 as a novel determinant of cardiovascular events. Circulation. 2006;113:2278–2284. - PubMed
    1. Croce K, Gao H, Wang Y, Mooroka T, Sakuma M, Shi C, Sukhova GK, Packard RR, Hogg N, Libby P, Simon DI. Myeloid-related protein-8/14 is critical for the biological response to vascular injury. Circulation. 2009;120:427–436. - PMC - PubMed
    1. Bouma G, Coppens JM, Lam-Tse WK, Luini W, Sintnicolaas K, Levering WH, Sozzani S, Drexhage HA, Versnel MA. An increased mrp8/14 expression and adhesion, but a decreased migration towards proinflammatory chemokines of type 1 diabetes monocytes. Clin Exp Immunol. 2005;141:509–517. - PMC - PubMed
    1. Frosch M, Vogl T, Seeliger S, Wulffraat N, Kuis W, Viemann D, Foell D, Sorg C, Sunderkotter C, Roth J. Expression of myeloid-related proteins 8 and 14 in systemic-onset juvenile rheumatoid arthritis. Arthritis Rheum. 2003;48:2622–2626. - PubMed
    1. Mortensen OH, Nielsen AR, Erikstrup C, Plomgaard P, Fischer CP, Krogh-Madsen R, Lindegaard B, Petersen AM, Taudorf S, Pedersen BK. Calprotectin--a novel marker of obesity. PLoS One. 2009;4:e7419. - PMC - PubMed

Publication types