. 2011 Mar 14;208(3):491-503.
doi: 10.1084/jem.20100269. Epub 2011 Mar 7.

Contribution of IL-17-producing gamma delta T cells to the efficacy of anticancer chemotherapy

Affiliations

Contribution of IL-17-producing gamma delta T cells to the efficacy of anticancer chemotherapy

Yuting Ma et al. J Exp Med. .

Erratum in

  • J Exp Med. 2011 Apr 11:208(4):869

Abstract

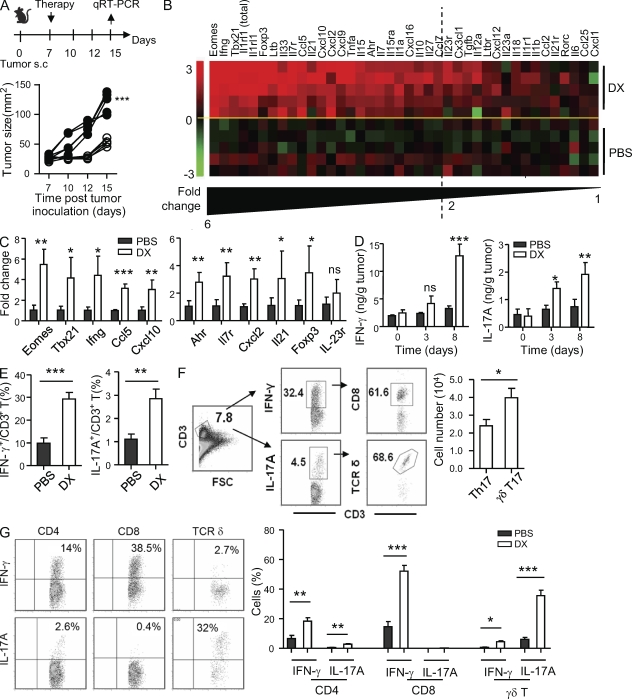
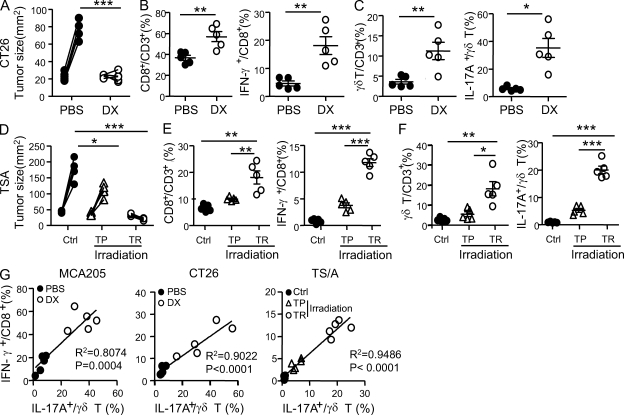
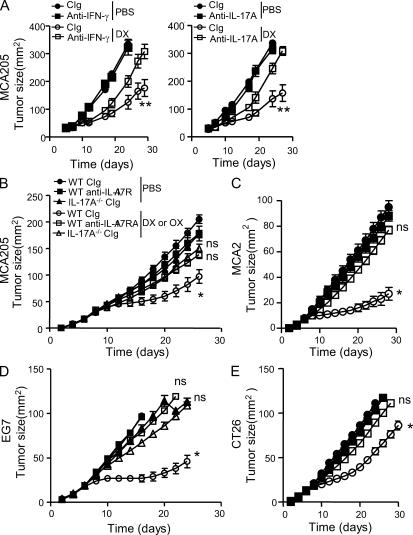
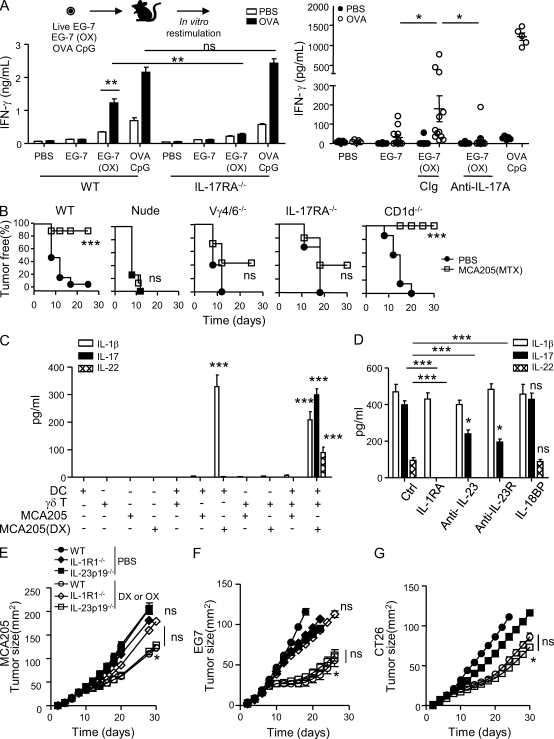
By triggering immunogenic cell death, some anticancer compounds, including anthracyclines and oxaliplatin, elicit tumor-specific, interferon-γ-producing CD8(+) αβ T lymphocytes (Tc1 CTLs) that are pivotal for an optimal therapeutic outcome. Here, we demonstrate that chemotherapy induces a rapid and prominent invasion of interleukin (IL)-17-producing γδ (Vγ4(+) and Vγ6(+)) T lymphocytes (γδ T17 cells) that precedes the accumulation of Tc1 CTLs within the tumor bed. In T cell receptor δ(-/-) or Vγ4/6(-/-) mice, the therapeutic efficacy of chemotherapy was compromised, no IL-17 was produced by tumor-infiltrating T cells, and Tc1 CTLs failed to invade the tumor after treatment. Although γδ T17 cells could produce both IL-17A and IL-22, the absence of a functional IL-17A-IL-17R pathway significantly reduced tumor-specific T cell responses elicited by tumor cell death, and the efficacy of chemotherapy in four independent transplantable tumor models. Adoptive transfer of γδ T cells restored the efficacy of chemotherapy in IL-17A(-/-) hosts. The anticancer effect of infused γδ T cells was lost when they lacked either IL-1R1 or IL-17A. Conventional helper CD4(+) αβ T cells failed to produce IL-17 after chemotherapy. We conclude that γδ T17 cells play a decisive role in chemotherapy-induced anticancer immune responses.


Figures

Figure 1.
Figure 1.
Th1 and Th17 immune response in tumors after chemotherapy. (A) Mice bearing MCA205 tumors were treated with PBS (solid symbols) or DX (open symbols) intratumorally at day 7 after tumor inoculation. Tumor growth was monitored at the indicated time points. (B and C) 8 d after chemotherapy (day 15 after tumor inoculation), tumor homogenates in PBS and DX groups were tested by quantitative RT-PCR (qRT-PCR). (B) Fold changes of gene expression are shown as a heat map. (C) Th1- and Th17-related gene expression in DX versus PBS groups (with a fold change >2) are listed. (D) Measurements of IFN-γ and IL-17A protein in tumor homogenates by ELISA at the indicated time points. (E and F) Single-cell suspension of MCA205 tumors (day 8 after DX) were analyzed by FACS. (E) Expression of IFN-γ and IL-17A in TILs was tested by intracellular staining gated on live, CD45+ and CD3+ cells. (F) IFN-γ+ and IL-17A+ cells were gated, and the proportions of CD3+ CD8+ cells and CD3+ TCR δ+ cells were examined in DX-treated tumors. A typical dot plot analysis (left) and the absolute numbers of Th17 and γδ T17 cells in the whole tumors (right) are shown. (G) IFN-γ and IL-17A production by total CD4+, CD8+, and TCR δ+ TILs. Representative FACS plots in DX-treated tumors (left) and the percentages in PBS- or DX-treated tumors (right) are shown. Each group contained at least five mice, and each experiment was performed at least twice, yielding similar results. Graphs depict mean ± SEM of fold change of gene expression (C), protein content (D), percentages, or absolute numbers of positive cells (E and G). *, P < 0.05; **, P < 0.01; ***, P < 0.001.
Figure 2.
Figure 2.
γδ T17 cells preceded Tc1 CTL into tumors after chemotherapy. (A) The percentages of IL-17– and IFN-γ–producing cells among all tumor infiltrating γδ T cells and CD8+ T cells, respectively, are plotted before and at the indicated time points after tumor inoculation. Mice were treated with PBS (filled symbols) or DX (open symbols) at day 7. (B) Ki67 expression on γδ T and CD8+ TILs 8 d after treatment. (C) The percentages of γδ T17 and Tc1 among all CD3+ TILs at the indicated time points after tumor inoculation. DX was given at day 7. These experiments were performed twice on 5–10 tumors at each time point. *, P < 0.05; **, P < 0.01.
Figure 3.
Figure 3.
Recruitment of both Tc1 and γδ T17 cells in CT26 and TS/A tumors that correlate with better tumor control. (A–C) CT26 colon cancer treated with anthracyclines. (A) Tumor size before and 8 d after treatment with PBS (filled symbols) or DX (open symbols). (B) The percentage of CD8+ T cells among CD3+ cells and of IFN-γ–producing cells among CD8+ T cells. (C) The percentage of γδ T cells among CD3+ cells and of IL-17A–producing cells among CD3+ γδ T cells. Data are presented as mean ± SEM with five tumors/group. (D–F) TS/A mammary cancer treated with x rays. (D) Established TS/A tumors were treated with local irradiation (open symbols) on day 10. Mice were segregated into nonresponders (tumor progression [TP], triangles) and responders (tumor regression [TR], circles) 22 d after radiotherapy (n = 5). (E) The percentage of CD8+ T cells among CD3+ cells and of IFN-γ-producing cells among CD8+ T cells; (F) The percentage of γδ T cells among CD3+ cells and of IL-17A–producing cells among CD3+ γδ T cells are indicated as mean ± SEM. (G) The correlation between the percentages of γδ T17 and Tc1 TILs in all tumors (treated or not) was plotted for MCA205, CT26, and TS/A tumors (each dot representing one mouse). Data are representative of two to three independent experiments. *, P < 0.05; **, P < 0.01; ***, P < 0.001.
Figure 4.
Figure 4.
A mandatory role for the IL-17A–IL-17RA pathway in the efficacy of chemotherapy. (A) Mice bearing established MCA205 sarcomas were treated with local PBS (filled symbols) or DX (open symbols) 7 d after tumor inoculation and with systemic neutralizing antibodies against mouse IFN-γ (left), IL-17A (right), or control Ig (CIg) i.p. every 2 d (3 injections, 200 µg/mouse) starting on the day of DX. (B–E) WT (circles or squares) or IL-17A−/− (triangles) mice bearing established MCA205 sarcomas (B), MCA2 (C), EG7 (D), or CT26 (E) tumors were treated with PBS (B-E, solid symbols), DX (B and C, open symbols), or OX (D and E, open symbols) together with systemic administration of neutralizing antibodies against IL-17RA (squares) or CIg. Tumor sizes are plotted as mean ± SEM for 5–15 mice/group, and each experiment was repeated at least 2 times, yielding similar results. *, P < 0.05; **, P < 0.01.
Figure 5.
Figure 5.
Role of γδ T17 in the priming of T cell responses during an immunogenic cell death and regulation by IL-1β. (A) OX-treated EG-7 cells were inoculated in the footpad of WT versus IL-17RA−/− mice (n = 5; left) along with anti–IL-17A neutralizing antibody (or CIg; right panel). OVA-specific IFN-γ secretion by draining LN cells was measured in vitro by ELISA after stimulation with OVA protein (1 mg/ml). OVA/CpG immunization was used as positive control. (B) Immunization with MTX-treated MCA205 and rechallenge with a tumorigenic dose of live MCA205 were performed at day 0 and day 7, respectively in WT C57Bl6 (n = 10), nude (n = 10), Vγ4/6−/− (n = 15), IL-17RA−/− (n = 8), and CD1d−/− (n = 6) mice. The percentages of tumor-free mice were scored at the indicated time points. Experiments in A and B were performed twice with similar results. (C) Production of IL-1β, IL-17A, and IL-22 from mixed co-cultures of LN-derived γδ T cells and/or BMDCs loaded or not loaded with live or DX-treated MCA205 was monitored by ELISA. Data are shown as mean ± SEM (D) Co-cultures of DX-treated MCA205/BMDC/γδ T were performed in the presence of 20 µg/ml IL-1RA (Amgen), anti–IL-23, or IL-23R neutralizing antibodies, or 10 µg/ml IL-18BP. Experiments in C and D were repeated three to six times. (E and G) Tumor size was monitored in WT (circles), IL-1R1−/− (diamonds), and IL-23p19−/− (squares) mice treated with PBS (filled symbols) or DX (open symbols; E and F), or in WT mice treated with systemic anti–IL-23 neutralizing antibodies (squares) or CIg (circles; G). Data are representative of 2 experiments with 6–10 mice/group. *, P < 0.05; **, P < 0.01; ***, P < 0.001.
Figure 6.
Figure 6.
The therapeutic activity of anthracyclines and tumor colonization of Tc1 depend upon Vγ4 Vγ6 γδ T cells. (A) WT, TCR δ−/−, or Vγ4/6−/− mice with established MCA205 tumors were injected intratumorally with PBS or DX. Tumor size was measured at the indicated time and plotted as mean ± SEM (n = 8/group). (B) Percentage of IL-17A– or IFN-γ–expressing cells within CD3+ TCRδ+ and CD3+ CD8+ TILs, respectively, in WT or Vγ4/6−/− mice. A typical dot plot is shown (left) and statistical analysis was performed with combined data from two independent experiments (right). *, P < 0.05; ***, P < 0.001.
Figure 7.
Figure 7.
Role of γδ T cell–derived IL-17A during chemotherapy. CD3+ TCR δ+ or CD3+ TCR δ T cells from WT mice (A), CD3+ TCR δ+ T cells from IL-17A−/− (B), or IL-1R1−/− (C) mice were injected intratumorally into MCA205-bearing WT mice (A–C) or IL-17A−/− mice (D) 2 d after PBS or DX treatment. Tumor sizes are plotted as mean ± SEM for five mice/group. Experiments were repeated two to three times with similar results. *, P < 0.05; **, P < 0.01.

References

    1. Apetoh L., Ghiringhelli F., Tesniere A., Obeid M., Ortiz C., Criollo A., Mignot G., Maiuri M.C., Ullrich E., Saulnier P., et al. 2007. Toll-like receptor 4-dependent contribution of the immune system to anticancer chemotherapy and radiotherapy. Nat. Med. 13:1050–1059 10.1038/nm1622 - DOI - PubMed
    1. Aujla S.J., Chan Y.R., Zheng M., Fei M., Askew D.J., Pociask D.A., Reinhart T.A., McAllister F., Edeal J., Gaus K., et al. 2008. IL-22 mediates mucosal host defense against Gram-negative bacterial pneumonia. Nat. Med. 14:275–281 10.1038/nm1710 - DOI - PMC - PubMed
    1. Casares N., Pequignot M.O., Tesniere A., Ghiringhelli F., Roux S., Chaput N., Schmitt E., Hamai A., Hervas-Stubbs S., Obeid M., et al. 2005. Caspase-dependent immunogenicity of doxorubicin-induced tumor cell death. J. Exp. Med. 202:1691–1701 10.1084/jem.20050915 - DOI - PMC - PubMed
    1. Couzi L., Levaillant Y., Jamai A., Pitard V., Lassalle R., Martin K., Garrigue I., Hawchar O., Siberchicot F., Moore N., et al. 2010. Cytomegalovirus-induced gammadelta T cells associate with reduced cancer risk after kidney transplantation. J. Am. Soc. Nephrol. 21:181–188 10.1681/ASN.2008101072 - DOI - PMC - PubMed
    1. Déchanet J., Merville P., Lim A., Retière C., Pitard V., Lafarge X., Michelson S., Méric C., Hallet M.M., Kourilsky P., et al. 1999. Implication of gammadelta T cells in the human immune response to cytomegalovirus. J. Clin. Invest. 103:1437–1449 10.1172/JCI5409 - DOI - PMC - PubMed

Publication types

MeSH terms