. 2011 Mar 14;208(3):577-92.
doi: 10.1084/jem.20100619. Epub 2011 Mar 7.

VISTA, a novel mouse Ig superfamily ligand that negatively regulates T cell responses

Affiliations

VISTA, a novel mouse Ig superfamily ligand that negatively regulates T cell responses

Li Wang et al. J Exp Med. .

Abstract

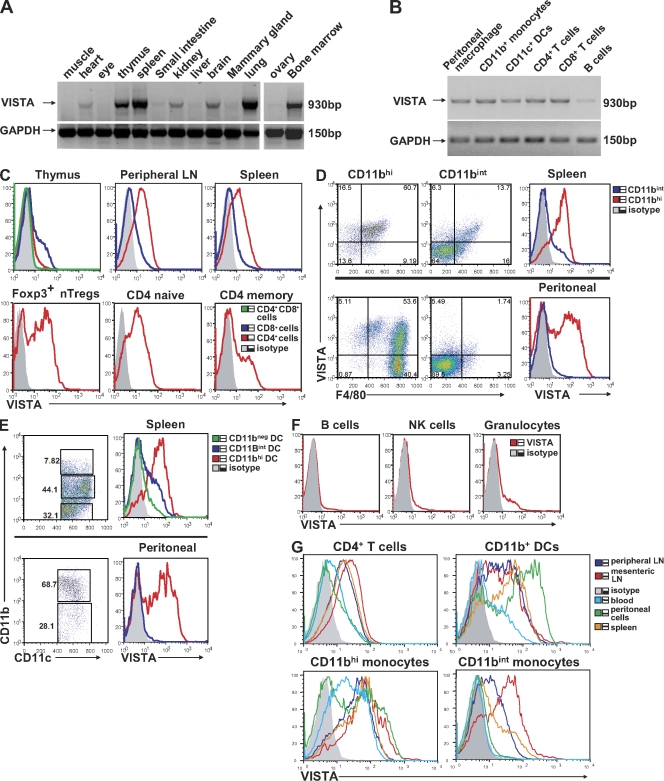
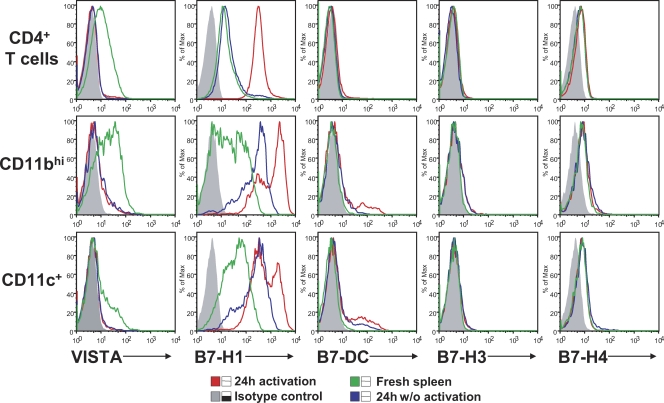
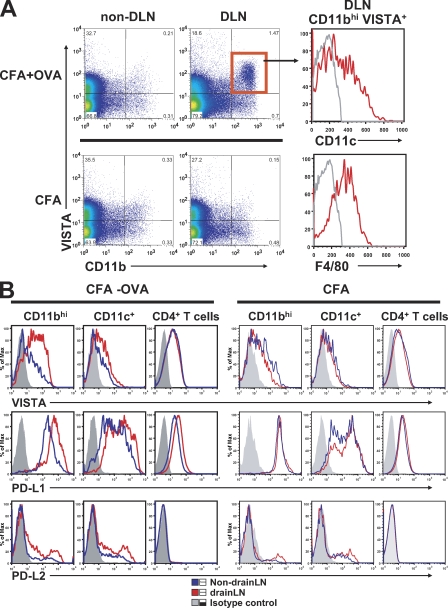
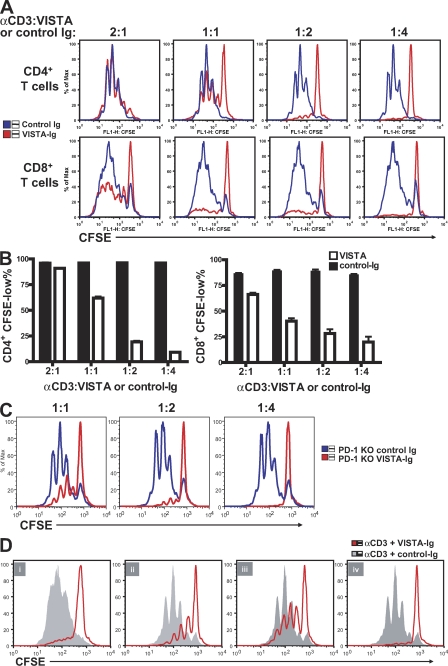
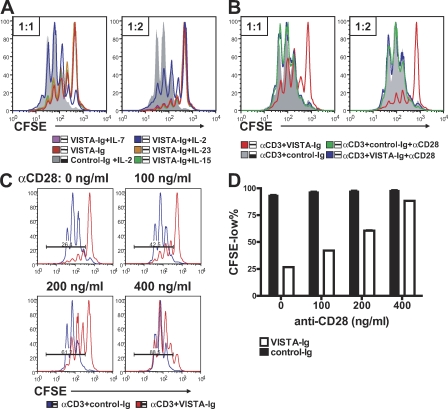
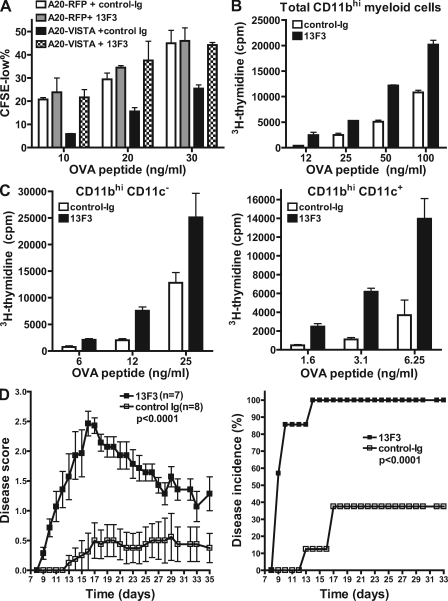
The immunoglobulin (Ig) superfamily consists of many critical immune regulators, including the B7 family ligands and receptors. In this study, we identify a novel and structurally distinct Ig superfamily inhibitory ligand, whose extracellular domain bears homology to the B7 family ligand PD-L1. This molecule is designated V-domain Ig suppressor of T cell activation (VISTA). VISTA is primarily expressed on hematopoietic cells, and VISTA expression is highly regulated on myeloid antigen-presenting cells (APCs) and T cells. A soluble VISTA-Ig fusion protein or VISTA expression on APCs inhibits T cell proliferation and cytokine production in vitro. A VISTA-specific monoclonal antibody interferes with VISTA-induced suppression of T cell responses by VISTA-expressing APCs in vitro. Furthermore, anti-VISTA treatment exacerbates the development of the T cell-mediated autoimmune disease experimental autoimmune encephalomyelitis in mice. Finally, VISTA overexpression on tumor cells interferes with protective antitumor immunity in vivo in mice. These findings show that VISTA, a novel immunoregulatory molecule, has functional activities that are nonredundant with other Ig superfamily members and may play a role in the development of autoimmunity and immune surveillance in cancer.


Figures

Figure 1.
Figure 1.
Sequence and structural analysis of VISTA. (A) The primary amino acid sequence of mouse VISTA with the Ig-V domain, the stalk segment, and the transmembrane region highlighted in blue, green, and red, respectively. Cysteines in the ectodomain region are indicated by underlining. (B) A comparative protein structure model of mouse VISTA using PD-L1 as the template (Protein Data Bank accession no. 3BIS). The five cysteine residues in the Ig-V domain are illustrated as orange sticks. Based on this model, the VISTA Ig-V domain has the canonical disulfide bond between the B and F strands, as well as three additional cysteines, some of which can potentially form inter- and intramolecular disulfide bonds. An additional invariant cysteine is present in the stalk region following the G strand (not depicted). The β strands (A–G) are marked as green and blue. The C″-D loop is marked by an arrow. (C) Multiple sequence alignment of the Ig-V domains of several B7 family members and VISTA. The predicted secondary structure (using arrows, springs, and “T”s for strands, helices, and β-turns, respectively) is marked above the alignment and is based on the VISTA structural model. (D) Multiple sequence alignment of VISTA orthologues. Invariant residues are represented by the red background, and physico-chemically conserved positions are represented by red letters. Conserved amino acids are marked by blue boxes. Conservation is calculated on the basis of 36 VISTA orthologous proteins, but only 9 representatives are shown. The canonical cysteine pair (B and F strands) that is conserved in almost all Ig superfamily members is highlighted by red circles, whereas cysteines that are specific to VISTA are marked by blue circles. The unique VISTA cysteine pattern is conserved in all orthologues from zebrafish to human.
Figure 2.
Figure 2.
Tissue expression and hematopoietic cell expression patterns of VISTA. (A and B) RT-PCR of full-length VISTA from mouse tissues (A) and from mouse hematopoietic cell types (B). GAPDH was used as a loading control. (C–F) Flow cytometry analysis of VISTA expression on various hematopoietic cell types. (C) Total populations of CD4+ and CD8+ T cells from thymus, LN, and spleen or subsets of CD4+ T cells (i.e., Foxp3+ nTreg cells and naive and memory CD4+ T cells) from spleen. (D and E) CD11b+ monocytes and CD11c+ DC subsets from spleen and peritoneal cavity. (F) Splenic B cells, NK cells, and granulocytes. (G) VISTA expression on hematopoietic cells from different tissue sites, including mesenteric LN, peripheral LN, spleen, blood, and peritoneal cavity. Representative data from at least three independent experiments are shown.
Figure 3.
Figure 3.
Comparison of expression of VISTA and other B7 family ligands on in vitro cultured spleen cells. Expression of VISTA and other B7 family ligands (i.e., PD-L1, PD-L2, B7-H3, and B7-H4) on hematopoietic cell types, including CD4+ T cells, CD11bhi monocytes, and CD11c+ DCs, was compared. Cells were either freshly isolated or in vitro cultured for 24 h, with and without activation. CD4+ T cells were activated with 5 µg/ml plate-bound α-CD3, and CD11bhi monocytes and CD11c+ DCs were activated with 20 ng/ml IFN-γ and 200 ng/ml LPS. Representative results from three independent experiments are shown.
Figure 4.
Figure 4.
Comparison of in vivo expression patterns of VISTA and B7 family ligands PD-L1 and PD-L2 during immunization. DO11.10 TCR transgenic mice were immunized with 200 µg chicken OVA emulsified in CFA or CFA alone on the flank. Draining LN (DLN) and nondraining LN cells were collected after 24 h and analyzed by flow cytometry for the expression of VISTA, PD-L1, and PD-L2. (A) Representative VISTA expression profile on CD11b+ monocytes at 24 h after immunization. (B) Expression of VISTA, PD-L1, and PD-L2 on CD11bhi monocytes, CD11c+ DCs, and CD4+ T cells was analyzed at 24 h after immunization. Shown are representative results from at least four independent experiments.
Figure 5.
Figure 5.
Immobilized VISTA-Ig fusion protein inhibited CD4+ and CD8+ T cell proliferation. CFSE-labeled CD4+ and CD8+ T cells were stimulated by plate-bound α-CD3 together with co-absorbed VISTA-Ig or control-Ig protein at the indicated ratios. (A) Representative CFSE dilution profiles. (B) The percentage of CFSE-low cells was quantified and shown as mean ± SEM. (C) As in A, but using CD4+ T cells from PD-1–deficient mice. (D) Wild-type CD4+ T cells were activated in the presence of VISTA-Ig or control-Ig for 72 (i) or 24 h (ii–iv). 24-h preactivated cells were harvested and restimulated under specified conditions for another 48 h. (ii) Preactivation with VISTA-Ig and restimulation with α-CD3. (iii) Preactivation with α-CD3 and restimulation with control-Ig or VISTA-Ig. (iv) Preactivation with control-Ig or VISTA-Ig and restimulation with the same Ig protein. Cell proliferation was analyzed at the end of the 72-h culture. Duplicated wells were analyzed for all conditions. Shown are representative results from at least four experiments.
Figure 6.
Figure 6.
VISTA-Ig inhibited cytokine production by CD4+ and CD8+ T cells. (A and B) Bulk purified CD4+ T cells were stimulated with plate-bound α-CD3 and VISTA-Ig or control-Ig at the stated ratios. Culture supernatants were collected after 24 and 48 h. Levels of IL-2 and IFN-γ were analyzed by ELISA. (C and D) CD4+ T cells were sorted into naive (CD25CD44lowCD62Lhi) and memory (CD25CD44hiCD62Llow) cell populations. Cells were stimulated with plate-bound α-CD3 in the presence of VISTA-Ig or control-Ig at a ratio of 1:2 (2.5 µg/ml α-CD3 and 5 µg/ml VISTA-Ig or control-Ig). Culture supernatants were collected at 48 h, and the level of IL-2 and IFN-γ was analyzed by ELISA. (E) Bulk purified CD8+ T cells were stimulated with plate-bound α-CD3 and VISTA-Ig or control-Ig at the indicated ratios. The level of IFN-γ in the culture supernatant was analyzed by ELISA. For all conditions, supernatant from six duplicated wells was pooled for ELISA analysis and shown as means ± SEM. Shown are representative results from at least three experiments.
Figure 7.
Figure 7.
VISTA-Ig–mediated suppression could overcome a moderate level of co-stimulation provided by CD28 but was completely reversed by a high level of co-stimulation, as well as partially rescued by exogenous IL-2. (A and B) CFSE-labeled CD4+ T cells were activated by 2.5 µg/ml plate-bound α-CD3 together with either VISTA-Ig or control-Ig at 1:1 and 1:2 ratios. (A) 40 ng/ml soluble mIL-2, mIL-7, mIL-15, or mIL-23 was also added as indicated to the cell culture. (B) 1 µg/ml α-CD28 was immobilized together with 2.5 µg/ml α-CD3 and Ig proteins at the indicated ratios. Cell proliferation was analyzed at 72 h by examining CFSE division profiles. (C and D) To examine the suppressive activity of VISTA in the presence of lower levels of co-stimulation, the indicated amounts of α-CD28 were coated together with 2.5 µg/ml α-CD3 and 10 µg/ml VISTA-Ig fusion proteins or control-Ig fusion protein to stimulate CFSE-labeled CD4+ T cells. Cell proliferation was analyzed at 72 h. Percentages of CFSElow cells were quantified and shown as means ± SEM in D. Duplicated wells were analyzed in all conditions. Representative CFSE profiles from three independent experiments are shown.
Figure 8.
Figure 8.
VISTA expressed on APCs suppressed CD4+ T cell proliferation. (A and B) A20 cells were transduced with retrovirus expressing either VISTA-RFP or RFP control molecules and sorted to achieve homogenous level of expression. To test their ability as APCs, A20-VISTA or A20-RFP cells were mitomycin C treated and mixed with CFSE-labeled DO11.10 TCR transgenic CD4+ T cells in the presence of a titrated amount of OVA peptide. CFSE dilution in DO11 cells was analyzed after 72 h. (A) Representative CFSE profiles. (B) Percentages of CFSElow cells were quantified and shown as mean ± SEM. (C) BMDCs were transduced with RFP or VISTA-RFP retrovirus during 10-d culture period. Transduced and nontransduced DCs were sorted based on RFP expression and used to stimulate CFSE-labeled OT-II transgenic CD4+ T cells in the presence of the indicated amount of OVA peptide. CFSE dilution was analyzed after 72 h. For all experiments, duplicated wells were analyzed in all conditions, and representative results from three independent experiments are shown.
Figure 9.
Figure 9.
VISTA overexpression on tumor cells overcomes protective antitumor immunity. MCA105 tumor cells overexpressing VISTA or RFP control protein were generated by retroviral transduction and sorted to homogeneity. To generate protective immunity, naive mice were vaccinated with irradiated MCA105 tumor cells subcutaneously on the left flank. (A) Vaccinated mice were challenged 14 d later with live MCA105VISTA or MCA105RFP tumor cells subcutaneously on the right flank. Tumor growth was monitored every 2 d. Tumor size is shown as mean ± SEM. Shown are representative results from three independent repeats. (B) Vaccinated mice were either untreated or depleted of both CD4+ and CD8+ T cells by mAbs before live tumor challenge. Tumor size was monitored as in A and shown as mean ± SEM. Shown are representative results from two independent repeats. For all experiments, ratios indicate the number of tumor-bearing mice among total number of mice per group. The statistical differences (p-values) were assessed with an unpaired Mann-Whitney test.
Figure 10.
Figure 10.
VISTA blockade using a specific mAb enhanced CD4+ T cell response in vitro and in vivo. (A) An mAb clone 13F3 neutralized VISTA-mediated suppression in vitro. A20-RFP and A20-VISTA cells were used to stimulate CFSE-labeled DO11.10 CD4+ T cells in the presence of cognate OVA peptide. 20 µg/ml VISTA-specific mAb 13F3 or control-Ig was added as indicated. CFSE dilution was analyzed after 72 h, and percentages of CFSElow cells are shown as mean ± SEM. Duplicated wells were analyzed for all conditions. (B and C) Total CD11bhi myeloid cells (B) or CD11bhiCD11c monocytes (C) and CD11bhiCD11c+ myeloid DCs (C) sorted from naive splenocytes were irradiated and used to stimulate CFSE-labeled OT-II transgenic CD4+ T cells in the presence of OVA peptide. Cell proliferation was measured by incorporation of tritiated thymidine during the last 8 h of a 72-h culture period and shown as mean ± SEM. Triplicate wells were analyzed in all conditions. (D) Mean clinical scores and disease incidence of mice (n = 8 per group) that received suboptimal dosage of activated encephalitogenic CD4+ T cells (1.5 million). Recipient mice were treated with 400 µg 13F3 or control-Ig every 3 d, and disease course was monitored every day. Disease scores are shown as means ± SEM and are the representative results from three independent experiments. The statistical differences (p-values) were assessed with an unpaired Mann-Whitney test.

References

    1. Altschul S.F., Gish W., Miller W., Myers E.W., Lipman D.J. 1990. Basic local alignment search tool. J. Mol. Biol. 215:403–410 - PubMed
    1. Ansari M.J., Salama A.D., Chitnis T., Smith R.N., Yagita H., Akiba H., Yamazaki T., Azuma M., Iwai H., Khoury S.J., et al. 2003. The programmed death-1 (PD-1) pathway regulates autoimmune diabetes in nonobese diabetic (NOD) mice. J. Exp. Med. 198:63–69 10.1084/jem.20022125 - DOI - PMC - PubMed
    1. Atkinson H.J., Morris J.H., Ferrin T.E., Babbitt P.C. 2009. Using sequence similarity networks for visualization of relationships across diverse protein superfamilies. PLoS ONE. 4:e4345 10.1371/journal.pone.0004345 - DOI - PMC - PubMed
    1. Berman H.M., Westbrook J., Feng Z., Gilliland G., Bhat T.N., Weissig H., Shindyalov I.N., Bourne P.E. 2000. The Protein Data Bank. Nucleic Acids Res. 28:235–242 10.1093/nar/28.1.235 - DOI - PMC - PubMed
    1. Blank C., Brown I., Peterson A.C., Spiotto M., Iwai Y., Honjo T., Gajewski T.F. 2004. PD-L1/B7H-1 inhibits the effector phase of tumor rejection by T cell receptor (TCR) transgenic CD8+ T cells. Cancer Res. 64:1140–1145 10.1158/0008-5472.CAN-03-3259 - DOI - PubMed

Publication types

MeSH terms