. 2011 Mar 7;192(5):751-65.
doi: 10.1083/jcb.201007063.

Defining the earliest step of cardiovascular progenitor specification during embryonic stem cell differentiation

Affiliations

Defining the earliest step of cardiovascular progenitor specification during embryonic stem cell differentiation

Antoine Bondue et al. J Cell Biol. .

Abstract

During embryonic development and embryonic stem cell (ESC) differentiation, the different cell lineages of the mature heart arise from two types of multipotent cardiovascular progenitors (MCPs), the first and second heart fields. A key question is whether these two MCP populations arise from differentiation of a common progenitor. In this paper, we engineered Mesp1-green fluorescent protein (GFP) ESCs to isolate early MCPs during ESC differentiation. Mesp1-GFP cells are strongly enriched for MCPs, presenting the ability to differentiate into multiple cardiovascular lineages from both heart fields in vitro and in vivo. Transcriptional profiling of Mesp1-GFP cells uncovered cell surface markers expressed by MCPs allowing their prospective isolation. Mesp1 is required for MCP specification and the expression of key cardiovascular transcription factors. Isl1 is expressed in a subset of early Mesp1-expressing cells independently of Mesp1 and acts together with Mesp1 to promote cardiovascular differentiation. Our study identifies the early MCPs residing at the top of the cellular hierarchy of cardiovascular lineages during ESC differentiation.


Figures

Figure 1.
Figure 1.
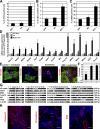
Engineering ESCs expressing Venus-GFP under the regulatory region of Mesp1. (A) Schematic representation of the Mesp1 reporter transgene. Venus-GFP is cloned under the regulatory sequences of Mesp1 that allowed transgene expression in the cardiogenic mesoderm. (B, right) Detection of GFP in Mesp1-GFP ESCs at D3 of differentiation. (left) Unmodified ESCs at the same day of differentiation are used as a control. Bars, 50 µm. (C and D) Kinetics of Mesp1 mRNA expression measured by RT–quantitative PCR (C), and Mesp1-GFP expression as detected by FACS (D). Results are normalized for Mesp1 expression in undifferentiated ESCs (C) or represent the percentage of Mesp1-GFP–positive cells (D). (E) Relative expression of Mesp1 and GFP transcripts in Mesp1-GFP–expressing cells (GFP positive [pos]) and in Mesp1-GFP–nonexpressing cells (GFP negative [neg]) isolated by FACS at D3. Results are normalized for the expression of the transcripts in all sorted cells (gray bars). Error bars indicate means ± SEM; n = 3. FRT, flippase recognition target. pA, polyadenylation. PGK, phosphoglycerate kinase.
Figure 2.
Figure 2.
Isolation and functional characterization of early Mesp1-GFP–expressing cells. (A–C) Expression of cardiovascular markers after 8 d of differentiation of the indicated cell populations isolated at D3. Cardiac and endothelial differentiation were quantified by FACS using a cardiac-specific isoform of the troponin T (cTNT; A) and the endothelial marker CD31 (B). SMC differentiation was assessed by counting the percentage of cells expressing smooth muscle actin (SMA) on cytospin slides (C; also see Fig. S1 A). n = 4. (D) Relative mRNA expression of cardiovascular markers in Mesp1-GFP positive–derived cells (black bars) and in all sorted cells (gray bars) assessed by real-time RT-PCR 8 d after replating. Results are normalized to the expression of the different transcripts in the Mesp1-GFP negative (Neg)–derived cells (white bars). n = 4. (E) Immunostaining for cTNT (CMs), VE-cadherin (VE-cadh; ECs), and SMA (SMCs) in individual colonies obtained after the replating at the clonal density of isolated Mesp1-GFP cells at D3 and cultured for 13 d. Bars, 50 µm. (F) Quantification of colonies expressing cardiovascular (cTNT and VE-cadherin), cardiac (cTNT), and endothelial (VE-cadherin) markers as obtained in E. n = 3. (G) RT-PCR analysis of cardiovascular markers in colonies derived from a single Mesp1-GFP isolated cell in 96 wells after 13 d of differentiation. Only clones positive for β-actin are shown, with dividing lines indicating the removal of intervening lanes from the gels. Samples tested in different experiments are shown as distinct panels with their respective positive (+) and negative (−) control samples. (H) Cardiovascular potential of Mesp1-GFP isolated cells at D3 of ESC differentiation, which were transplanted under the kidney capsule of nonobese diabetic/severe combined immunodeficient mice. Cardiovascular differentiation was assessed after 4 wk by immunostaining for cTNT, VE-cadherin, and SMA. n = 3. Bars, 100 µm. Error bars indicate means ± SEM.
Figure 3.
Figure 3.
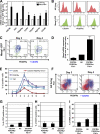
Isolation and functional characterization of early MCPs using a combination of monoclonal antibodies. (A) Cell surface marker expression in Mesp1-GFP–expressing cells as measured by real-time RT-PCR in isolated Mesp1-GFP–expressing cells at D3. Results are normalized for the mRNA expression in GFP-negative cells. n = 3. (B) Detection of CXCR4, PDGFRa, and Flk1 by FACS at D3 in all living cells (top) and in the Mesp1-GFP population (bottom). (C) Multicolor FACS analysis gated on Mesp1-GFP cells of CXCR4, PDGFRa, and Flk1 expression at D3 and D4. (D) Enrichment of Mesp1 expression in TP cells at D3 as measured by RT-PCR on FACS-isolated cells. Results are normalized for the relative transcript expression in all sorted cells. n = 3. (E) Temporal expression of CXCR4, PDGFRa, and Flk1 during ESC differentiation as detected by FACS. n = 2. (F) Combined detection of CXCR4, PDGFRa, and Flk1 expression at D3 and D4 in all living cells. (C and F) Percentages of cells in each quadrant are shown, and the percentage of CXCR4/PDGFRa/Flk1 TP cells are shown in parentheses. (G–I) Cardiac (G), endothelial (H), and SMC (I; also see Fig. S1 C) differentiation of TP cells as performed in Fig. 2 (A–C). n = 4. Error bars indicate means ± SEM.
Figure 4.
Figure 4.
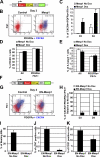
Mesp1 rapidly promotes and is required for MCP specification and cardiac differentiation. (A) Schematic representation of Dox-inducible Mesp1 ESCs. (B) FACS analysis of the expression of CXCR4, PDGFRa, and Flk1 in Mesp1 Dox-inducible ESCs at D3, 24 h after Dox addition. (C) FACS quantification of CXCR4/PDGFRa/Flk1 TP cells in Mesp1 Dox-inducible ESCs 24 (D3) and 48 h (D4) after Dox addition. n = 3. (D and E) FACS quantification of proliferation (BrdU; D) and apoptosis (active caspase-3; E) in PDGFRa+/Flk1+ cells and in all Mesp1-inducible ESCs in the presence and absence of Dox for 24 h (D3). n = 2. (F) Schematic representation of Dox-inducible Engrailed (Engr)-Mesp1 ESCs (EN-Mesp1). (G) FACS analysis of CXCR4, PDGFRa, and Flk1 expression in EN-Mesp1–inducible ESCs at D4, 48 h after Dox addition. (B and G) Percentages of cells in each quadrant are shown, and the percentage of CXCR4/PDGFRa/Flk1 TP cells are shown in parentheses. (H) FACS quantification of TP cells in EN-Mesp1–inducible ESCs 24 (D3) and 48 h (D4) after Dox addition. Results are normalized to unstimulated cells. n = 3. (I) Quantification of beating areas in EN-Mesp1 ESCs in the presence or in the absence of Dox at D8. n = 3. (J and K) FACS quantification of cTNT (J) and CD31 (K) in EN-Mesp1–expressing cells. n = 3. Error bars indicate means ± SEM. TRE, tetracycline-responsive element. EB, embryoid body.
Figure 5.
Figure 5.
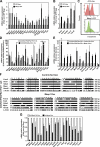
Cardiovascular and EMT transcription factors regulated by Mesp1 in early MCPs. (A and B) Real-time RT-PCR analysis of mRNA relative expression of cardiovascular (A) and EMT (B) transcription factors in FACS-isolated Mesp1-GFP cells at D3 (black bars). Results are normalized for the transcript expression in Mesp1-GFP–negative (Neg) cells (white bars). (C) E-Cadherin expression in all cells and in Mesp1-expressing cells as measured by FACS. (D) Real-time RT-PCR analysis of the expression of cardiovascular transcription factors in CXCR4/PDGFRa/Flk1 TP cells isolated at D3 (white bars) and D4 (black bars). Results are normalized for the mRNA expression in CXCR4/PDGFRa/Flk1 cells. Numbers at the top of the bars indicate the fold change. (E) Real-time RT-PCR analysis of the expression of cardiovascular transcription factors within the TP population in Dox-inducible Mesp1 ESCs isolated at D4 in the presence or in the absence of Dox for 48 h. Results are normalized for transcript expression in unstimulated TP cells. (F) RT-PCR analysis of cardiovascular transcription factor expression in single TP isolated cells from Mesp1-inducible ESCs in the presence or in the absence of Dox for 48 h. Only clones positive for β-actin are shown, with dividing lines indicating the removal of intervening lanes from the gels. Samples tested in different experiments are shown as distinct panels with their respective positive (+) and negative (−) control samples. (G) Expression of cardiovascular transcription factors in Dox-inducible EN-Mesp1 ESCs at D3. Results are normalized for the expression in Dox-untreated cells. Error bars indicate means ± SEM (n = 3).
Figure 6.
Figure 6.
Isl1 is expressed in a subset of early Mesp1-expressing cells. (A and B) Quantification of Mesp1-GFP (A) and Isl1 (B) expression as measured by immunostaining of GFP and Isl1 on cytospin slides of Mesp1-GFP cells at D3 and D4. n = 3. (C and D) Confocal microscopy analysis of GFP (Mesp1) and Isl1 immunostaining in Mesp1-GFP cells at D3 (C) and D4 (D). (right) Magnification of the insets, and arrows indicate cells that coexpress Mesp1 and Isl1. Bars, 30 µm. (E and F) Quantification of Isl1 expression in Mesp1-GFP–expressing cells (E), and Mesp1 (GFP) expression in Isl1-expressing cells (F) at D3 and D4. More than 300 cells were counted in each condition. n = 3. Error bars indicate means ± SEM.
Figure 7.
Figure 7.
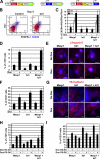
Isl1 and Mesp1 cooperate in promoting cardiovascular differentiation in ESCs. (A) Schematic representation of Mesp1, Isl1, and Mesp1/Isl1 Dox-inducible ESCs. (B) FACS analysis of CXCR4, PDGFRa, and Flk1 expression in Isl1-inducible ESCs at D4, 48 h in the presence or absence of Dox treatment. Percentages of cells in each quadrant are shown, and the percentage of CXCR4/PDGFRa/Flk1 TP cells are shown in parentheses. (C) FACS quantification of CXCR4/PDGFRa/Flk1 TP cells at 24 (D3) and 48 h (D4) in the presence or absence of Dox in Mesp1, Isl1, and Mesp1/Isl1 Dox-inducible ESCs. n = 4. (D) FACS quantification of cTNT expression at D8 in Mesp1, Isl1, and Mesp1/Isl1 Dox-inducible ESCs in the presence or absence of Dox from D2 to D4. n = 4. (E) Immunostaining of cTNT at D8 of differentiation in Dox-inducible Mesp1, Isl1, and Mesp1/Isl1 ESCs in the presence or absence of Dox from D2 to D4. Images shown are mosaïc acquisitions representative of at least four biologically independent experiments. Bars, 500 µm. (F) FACS quantification of CD31 expression at D7 in Mesp1, Isl1, and Mesp1/Isl1 Dox-inducible ESCs in the presence or absence of Dox from D2 to D4. n = 4. (G) Immunostaining for VE-Cadherin expression at D7 in Dox-inducible Mesp1, Isl1, and Mesp1/Isl1 ESCs in the presence or absence of Dox from D2 to D4. Images shown are representative of four biologically independent experiments. Bars, 100 µm. (H and I) FACS quantification of cTNT (H) and CD31 expression (I) in Mesp1, Isl1, and Mesp1/Isl1 Dox-inducible ESCs at D8 and D7 of differentiation, respectively, in the presence or absence of Dox from D2 to D4 or from D5 to D6. n = 4. Error bars indicate means ± SEM. TRE, tetracycline-responsive element.
Figure 8.
Figure 8.
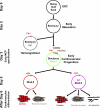
Model of the cellular hierarchy acting during cardiovascular lineage commitment. During ESC differentiation, Mesp1-expressing cells represent early tripotent cardiovascular progenitors that are able to differentiate at the clonal level into CMs, ECs, and SMCs, representing early common progenitors for all cardiovascular lineages.

References

    1. Bondue A., Blanpain C. 2010. Mesp1: a key regulator of cardiovascular lineage commitment. Circ. Res. 107:1414–1427 10.1161/CIRCRESAHA.110.227058 - DOI - PubMed
    1. Bondue A., Lapouge G., Paulissen C., Semeraro C., Iacovino M., Kyba M., Blanpain C. 2008. Mesp1 acts as a master regulator of multipotent cardiovascular progenitor specification. Cell Stem Cell. 3:69–84 10.1016/j.stem.2008.06.009 - DOI - PubMed
    1. Brade T., Gessert S., Kühl M., Pandur P. 2007. The amphibian second heart field: Xenopus islet-1 is required for cardiovascular development. Dev. Biol. 311:297–310 10.1016/j.ydbio.2007.08.004 - DOI - PubMed
    1. Bu L., Jiang X., Martin-Puig S., Caron L., Zhu S., Shao Y., Roberts D.J., Huang P.L., Domian I.J., Chien K.R. 2009. Human ISL1 heart progenitors generate diverse multipotent cardiovascular cell lineages. Nature. 460:113–117 10.1038/nature08191 - DOI - PubMed
    1. Buckingham M., Desplan C. 2010. Developmental mechanisms, patterning and evolution. Curr. Opin. Genet. Dev. 20:343–345 10.1016/j.gde.2010.06.006 - DOI - PubMed

Publication types

MeSH terms

Substances