. 2011 Mar 7;192(5):855-71.
doi: 10.1083/jcb.201007118.

A Nup133-dependent NPC-anchored network tethers centrosomes to the nuclear envelope in prophase

Affiliations

A Nup133-dependent NPC-anchored network tethers centrosomes to the nuclear envelope in prophase

Stéphanie Bolhy et al. J Cell Biol. .

Abstract

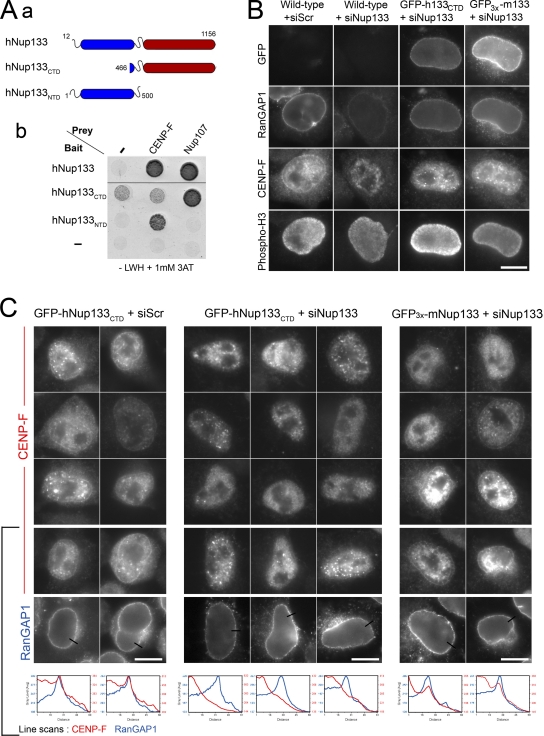
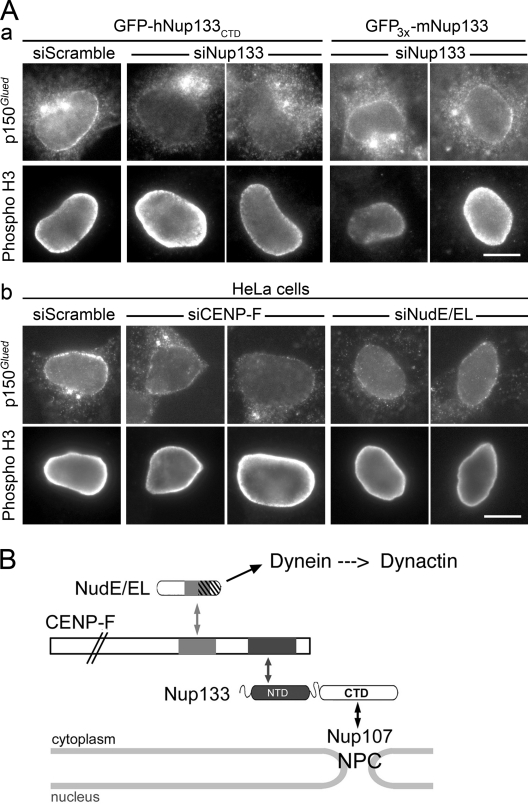
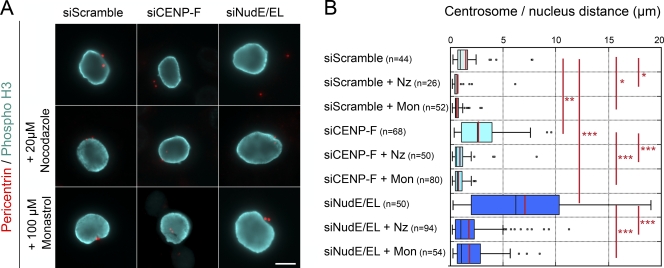
Centrosomes are closely associated with the nuclear envelope (NE) throughout the cell cycle and this association is maintained in prophase when they separate to establish the future mitotic spindle. At this stage, the kinetochore constituents CENP-F, NudE, NudEL, dynein, and dynactin accumulate at the NE. We demonstrate here that the N-terminal domain of the nuclear pore complex (NPC) protein Nup133, although largely dispensable for NPC assembly, is required for efficient anchoring of the dynein/dynactin complex to the NE in prophase. Nup133 exerts this function through an interaction network via CENP-F and NudE/EL. We show that this molecular chain is critical for maintaining centrosome association with the NE at mitotic entry and contributes to this process without interfering with the previously described RanBP2-BICD2-dependent pathway of centrosome anchoring. Finally, our study reveals that tethering of centrosomes to the nuclear surface at the G2/M transition contributes, along with other cellular mechanisms, to early stages of bipolar spindle assembly.


Figures

Figure 1.
Figure 1.
The N-terminal domain of hNup133 is largely dispensable for NPC assembly. (A) Control HeLa cells (WT) or cell lines stably expressing GFP-hNup133CTD or GFP3x-mNup133 were transfected with a scramble siRNA or with a hNup133 siRNA that does not target hNup133CTD and only mildly impacts mNup133 expression. After 3 d, whole-cell extracts were analyzed by Western blot using anti-hNup133 (which also recognizes mouse Nup133, albeit less efficiently than human Nup133) or anti-hNup107 antibodies. Anti–γ-tubulin was used as loading control. To allow quantifications, decreasing amounts of the reference sample were loaded (0.2-, 0.5-, and 1-fold equivalent). (B) Cells transfected with siRNAs as in A were fixed after 3 d and processed for immunofluorescence using anti-Nup107 and mAb414 antibodies. Bar, 20 µm.
Figure 2.
Figure 2.
The N-terminal domain of hNup133 tethers CENP-F at the NE in prophase. (Aa) Schematic representation of hNup133 constructs used in this study outlining its previously described β-propeller (N-terminal domain, NTD, blue) and α-solenoid (C-terminal domain, CTD, red) domains (adapted from Berke et al., 2004). (Ab) Yeast two-hybrid interactions between hNup133 (aa 12–1156), hNup133CTD (aa 466–1156) or hNup133NTD (aa 1–500), and hNup107 (aa 784–924), or CENP-F (aa 2644–3065) were analyzed as described in Materials and methods. Empty bait and prey vectors were used as negative controls (−). (B and C) Control HeLa cells (wild-type) or cell lines stably expressing GFP-hNup133CTD or GFP3x-mNup133 were transfected with a scramble siRNA (siScr) or with an siRNA duplex targeting the N-terminal domain of human Nup133. Cells were fixed after 3 d and processed for immunofluorescence using anti-RanGAP1, anti-CENP-F, and anti–phospho-H3 antibodies. Typical G2/M phospho-H3–positive cells are presented. Bars, 10 µm. In C, the anti-RanGAP1 signal is shown for cells on the bottom row. Line scans (with distances in pixels) measuring the intensity of CENP-F (red lines) and RanGAP1 (blue lines) reveal the peak of CENP-F that colocalizes with RanGAP1 at the NE in GFP-hNup133CTD treated with the scramble siRNA duplexes (left panels) or in GFP3x-mNup133 cells depleted for endogenous Nup133 (right panels), but not in Nup133-depleted GFP-hNup133CTD cells (middle panels). In some prophase cells, the bright intranuclear foci reflect the early recruitment of CENP-F at kinetochores.
Figure 3.
Figure 3.
CENP-F depletion impairs the NE localization of NudE/EL at the G2/M transition in HeLa cells. HeLa cells transfected with scramble or CENP-F siRNA duplexes were preextracted, fixed, and stained with anti-NudE/EL, anti-RanGAP1, and anti–phospho-H3 antibodies. Bars, 10 µm. See also Fig. S2.
Figure 4.
Figure 4.
hNup133 contributes to dynactin anchoring at the NE at the G2/M transition via CENP-F and NudE/EL. (A) GFP-hNup133CTD or GFP3x-mNup133 cells (a) or wild-type HeLa cells (b) transfected with the indicated siRNA duplexes were processed for immunofluorescence using anti-p150Glued and anti–phospho-H3 antibodies. Bars, 10 µm. See also Fig. S3. (B) Schematic representation of the interaction networks connecting Nup133 to dynein/dynactin. Proteins are represented on approximate scale except for CENP-F. Boxes indicate the minimal domains involved in the interactions between Nup133 and CENP-F (black boxes; this paper and Zuccolo et al., 2007), CENP-F and NudE/EL (gray boxes), and between NudE/EL and dynein (dashed area overlapping with the CENP-F interaction domain; Liang et al., 2007; Stehman et al., 2007; Vergnolle and Taylor, 2007). Although not represented on this scheme, association of CENP-F with the pool of Nup133 localized on the nuclear side of NPCs cannot be excluded.
Figure 5.
Figure 5.
Interfering with Nup133-anchored dynein/dynactin impairs the tethering of centrosomes to the NE. (A) Time-lapse imaging of HeLa cells expressing EB3-GFP (green) and H2B-mCherry (red) and transfected with CENP-F (c and c′), NudE/EL siRNA duplexes (d and d′), or with a CFP-p50/dynamitin construct (e), or of cells stably expressing GFP-hNup133CTD treated with hNup133 siRNAs and subsequently transfected with plasmids encoding EB3-GFP and H2B-mCherry (b). Time (in min:sec) was set at 0:00 when centrosome splitting just became detectable. Bars, 10 µm. See also Videos 1–6. (B) Tracks representing centrosome (CTR) movements in a control and a CENP-F–depleted cell (see Aa, Ac′, and Videos 1 and 4). Trajectories before centrosome separation (red) and tracks of the separated centrosomes (blue and green) were superimposed on a schematic representation of the cell border and nuclear position (gray shading) at the beginning of the video. White and black dots indicate the positions of centrosomes at the beginning and at the end of the videos, respectively. (C) Analysis of the centrosome–NE distance over time in HeLa cells expressing EB3-GFP and H2B-mCherry and treated with scramble or CENP-F siRNA duplexes. For each cell entering mitosis, the maximum distance between the centrosomes and the NE reached during the G2/M transition was plotted over the time centrosomes spent >3 µm away from the NE. Each dot represents a single cell. The number of cell quantified is indicated.
Figure 6.
Figure 6.
The Nup133-anchored network tethers centrosomes to the NPCs specifically in prophase. (A) GFP3x-mNup133 or GFP-hNup133CTD cells treated for 3 d with scramble or hNup133 siRNAs (a), HeLa cells treated for 2 d with scramble, CENP-F, or NudE/EL siRNA duplexes (b), or HeLa cells transfected with a GFP-p50/dynamitin or a DsRec-p150cc1 construct (c) were processed for immunofluorescence using anti-pericentrin and anti–phospho-H3 antibodies. In b, cells were incubated before fixation with 40 µM BrdU for 3 h and anti-BrdU antibodies were further used. Bars, 10 µm. (B) Distances between centrosomes and the NE were measured on cells processed as in A. Prophase cells were identified by phospho-H3 staining and S/early G2 cells as BrdU-positive cells after a 3-h pulse with BrdU (G1 cells were not analyzed because centrioles were reported to be very mobile at that stage of the cell cycle; Piel et al., 2000). Distances are represented as box-plots using KaleidaGraph (see Materials and methods). The black and red bars indicate the median and mean values, respectively. The total number of cells quantified is indicated (n). ***, P < 10−5; **, P < 10−3; ns, P > 0.1 obtained using the Student’s t test.
Figure 7.
Figure 7.
Centrosome movement away from the nuclear periphery requires microtubules and Eg5 activity. (A) HeLa cells transfected with scramble, CENP-F, or NudE/EL siRNA duplexes were either fixed (top row) or incubated with 20 µM nocodazole for 30 min or with 100 µM monastrol for 1 h before fixation. They were then stained with anti-pericentrin and anti–Phospho-H3 antibodies. Note that under those conditions, all phospho-H3–positive cells had entered prophase in the absence of microtubules or before Eg5 activation. All images arise from a single experimental dataset, although they were captured at different times using slightly different acquisition settings. Either a unique plane or maximum intensity projections of stacks are presented, as needed, depending on the locations of the centrosomes relative to the focal plane. Bar, 10 µm. (B) Distances between centrosomes and the NE, measured in phospho-H3–positive cells processed as above, are represented as box-plots using KaleidaGraph (see Materials and methods). The black and red bars indicate the median and mean values, respectively. The total number of cells quantified is indicated (n). ***, P < 10−5; **, P < 10−3; *, P < 0.05 obtained using the Student’s t test.
Figure 8.
Figure 8.
Relationship between the Nup133–CENP-F–NudE/EL and RanBP2–BICD2 pathways in centrosome tethering to the NE in U2OS cells. (A) Distances between centrosomes and nuclear periphery, measured in phospho-H3–positive U2OS cells treated for 3 d with scramble, CENP-F, BICD2, a combination of CENP-F and BICD2, or NudE/EL siRNA duplexes. Distances are represented as box-plots using KaleidaGraph (see Materials and methods). The black and red bars indicate the median and mean values, respectively. The total number of cells quantified is indicated (n). ***, P < 10−5; **, P < 10−3; ns, P > 0.1 obtained using the Student’s t test. (B) Extracts from U2OS cells treated with the indicated siRNA duplexes were analyzed by Western blot using anti-BICD2 antibodies. Decreasing amounts of the reference sample (scramble siRNA) were loaded (1-, 0.5-, and 0.25-fold equivalent) and anti–γ-tubulin was used as loading control. (C and D) U2OS cells transfected with the indicated siRNA duplexes were preextracted, fixed, and stained with anti–CENP-F and anti-RanGAP1 (C) or anti-BICD2 (D), along with anti–phospho-H3 antibodies and DAPI. Bars, 10 µm.
Figure 9.
Figure 9.
Centrosome disconnection from the NE causes transiently aberrant spindle structures. (A) Cells stably expressing GFP-hNup133CTD and GFP-CENP-A (green) were transfected with a plasmid encoding the microtubule-binding protein mCherry-MAP4 (red) and with scramble (a) or hNup133 (b and c) siRNAs. Cells were imaged from prophase on. Top panels: mCherry-MAP4 signal; bottom panels: overlay of the mCherry-MAP4 and GFP-CENP-A + GFP-hNup133CTD signals (note that the GFP-hNup133CTD signal is hardly detectable over the GFP-CENP-A signal). Time is in min:sec. Times of NEBD, metaphase plate formation, and metaphase/anaphase transition are indicated. Bar, 10 µm. See also Videos 7–9. (B) Time spent from chromosome condensation to metaphase/anaphase transition for cells stably expressing GFP-hNup133CTD and GFP-CENP-A treated with scramble or hNup133 siRNA duplexes as indicated. Each dot represents a single cell, and the dashed line represents the average mitotic duration. Cells that display major mitotic defects (red dots) or minor chromosome segregation defects (one mis-segregated or lagging chromosome; black dots) are indicated. The number of cell quantified, the average mitotic duration, and standard deviation are indicated. ns, the difference between control and Nup133-depleted cells was not statistically significant as determined using the Student’s t test. (C) Analysis of centrosome localization (arrows) in prometaphase and metaphase U2OS cells treated with scramble or NudE/EL siRNA duplexes. Cells were fixed and then stained with anti-pericentrin (red), anti–phospho-H3 (green), and RanGAP1 (gray) antibodies. RanGAP1 that localizes at NPCs in interphase and on the mitotic spindle in mitosis was used to simultaneously assess NPC disassembly and spindle formation. Representative cells at various stages of prometaphase and metaphase are presented. The percentage of mitotic cells displaying the indicated phenotypes is indicated. Bar, 10 µm.

References

    1. Antonin W., Ellenberg J., Dultz E. 2008. Nuclear pore complex assembly through the cell cycle: regulation and membrane organization. FEBS Lett. 582:2004–2016 10.1016/j.febslet.2008.02.067 - DOI - PubMed
    1. Ban R., Matsuzaki H., Akashi T., Sakashita G., Taniguchi H., Park S.Y., Tanaka H., Furukawa K., Urano T. 2009. Mitotic regulation of the stability of microtubule plus-end tracking protein EB3 by ubiquitin ligase SIAH-1 and Aurora mitotic kinases. J. Biol. Chem. 284:28367–28381 10.1074/jbc.M109.000273 - DOI - PMC - PubMed
    1. Beaudouin J., Gerlich D., Daigle N., Eils R., Ellenberg J. 2002. Nuclear envelope breakdown proceeds by microtubule-induced tearing of the lamina. Cell. 108:83–96 10.1016/S0092-8674(01)00627-4 - DOI - PubMed
    1. Belgareh N., Rabut G., Baï S.W., van Overbeek M., Beaudouin J., Daigle N., Zatsepina O.V., Pasteau F., Labas V., Fromont-Racine M., et al. 2001. An evolutionarily conserved NPC subcomplex, which redistributes in part to kinetochores in mammalian cells. J. Cell Biol. 154:1147–1160 10.1083/jcb.200101081 - DOI - PMC - PubMed
    1. Berke I.C., Boehmer T., Blobel G., Schwartz T.U. 2004. Structural and functional analysis of Nup133 domains reveals modular building blocks of the nuclear pore complex. J. Cell Biol. 167:591–597 10.1083/jcb.200408109 - DOI - PMC - PubMed

Publication types

MeSH terms