

Cell-ECM traction force modulates endogenous tension at cell-cell contacts
- PMID: 21383129
- PMCID: PMC3064395
- DOI: 10.1073/pnas.1011123108
Cell-ECM traction force modulates endogenous tension at cell-cell contacts
Abstract
Cells in tissues are mechanically coupled both to the ECM and neighboring cells, but the coordination and interdependency of forces sustained at cell-ECM and cell-cell adhesions are unknown. In this paper, we demonstrate that the endogenous force sustained at the cell-cell contact between a pair of epithelial cells is approximately 100 nN, directed perpendicular to the cell-cell interface and concentrated at the contact edges. This force is stably maintained over time despite significant fluctuations in cell-cell contact length and cell morphology. A direct relationship between the total cellular traction force on the ECM and the endogenous cell-cell force exists, indicating that the cell-cell tension is a constant fraction of the cell-ECM traction. Thus, modulation of ECM properties that impact cell-ECM traction alters cell-cell tension. Finally, we show in a minimal model of a tissue that all cells experience similar forces from the surrounding microenvironment, despite differences in the extent of cell-ECM and cell-cell adhesion. This interdependence of cell-cell and cell-ECM forces has significant implications for the maintenance of the mechanical integrity of tissues, mechanotransduction, and tumor mechanobiology.
Conflict of interest statement
The authors declare no conflict of interest.
Figures

 , and expressed as a percentage (number of cells = 16). (D) A pair of contacting MDCK cells expressing GFP-E-cadherin with traction stress vectors overlaid (red arrows). Outline of the regions used to calculate the force balance within the cell pair or a single cell are indicated by the green and yellow lines, respectively. (E) Heat-scale plot of traction stress magnitudes of the cell pair shown in D. (F, Top) Schematic of side view of the cell pair on traction gel with traction stresses (red arrows) and cell–cell forces (black arrows) depicted. (Bottom) Histogram of the unbalanced traction force, as measured in C for both a cell pair (green) and a single cell within the cell pair (yellow) (number of cell pairs = 24). (G) Net force exerted by cell 2 on cell 1, Fcell1, as a function of the force exerted by cell 1 on cell 2, Fcell2. Dashed line indicates a slope of one. (Inset) Schematic of a cell pair depicting Fcell1 and Fcell2. (H) Histogram of the endogenous cell–cell force; mean ± SD is 100 ± 40 nN. (I) Histogram of the angle between the cell–cell force and the line joining the edges of the cell–cell contact; mean ± SD is 88 ± 180. (Inset) Schematic depicting the angle calculated. Scale bar in A, B, D, and E is 5 μm. Reference traction vector in A and D is 950 Pa.
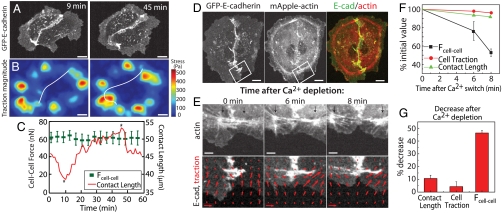
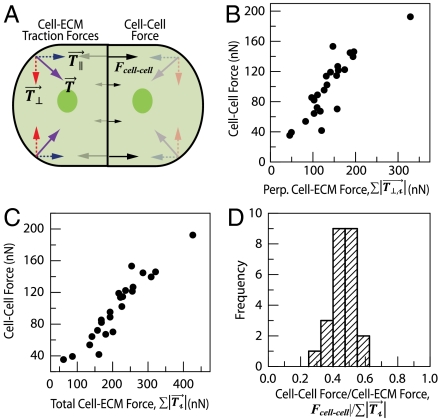
 ) can be deconstructed into a component that is parallel (blue arrow,
 ) and perpendicular (red arrow,
  ) to the cell–cell force. Cell–cell forces (
 , black arrows) act primarily perpendicular to the cell–cell contact. (B) Cell–cell force as a function of the total traction force per cell directed perpendicular to the cell–cell force. Data are for n = 24 MDCK cell pairs. (C) Cell–cell force as a function of the total traction force exerted per cell. (D) Histogram of the ratio of the cell–cell force to the total traction force exerted per cell, mean ± SD = 0.47 ± 0.07.
References
-
- Paluch E, Heisenberg C-P. Biology and physics of cell shape changes in development. Curr Biol. 2009;19:R790–R799. - PubMed
-
- Gumbiner BM. Regulation of cadherin-mediated adhesion in morphogenesis. Nat Rev Mol Cell Biol. 2005;6:622–634. - PubMed
-
- Chen CS, Tan J, Tien J. Mechanotransduction at cell-matrix and cell-cell contacts. Annu Rev Biomed Eng. 2004;6:275–302. - PubMed
Publication types
MeSH terms
Grants and funding
LinkOut - more resources
Full Text Sources
Other Literature Sources
