. 2011 Sep 13;108 Suppl 3(Suppl 3):15580-7.
doi: 10.1073/pnas.1014837108. Epub 2011 Mar 7.

Quantifying the buildup in extent and complexity of free exploration in mice

Affiliations

Quantifying the buildup in extent and complexity of free exploration in mice

Yoav Benjamini et al. Proc Natl Acad Sci U S A. .

Erratum in

  • Proc Natl Acad Sci U S A. 2011 Sep 13;108(37):15534

Abstract

To obtain a perspective on an animal's own functional world, we study its behavior in situations that allow the animal to regulate the growth rate of its behavior and provide us with the opportunity to quantify its moment-by-moment developmental dynamics. Thus, we are able to show that mouse exploratory behavior consists of sequences of repeated motion: iterative processes that increase in extent and complexity, whose presumed function is a systematic active management of input acquired during the exploration of a novel environment. We use this study to demonstrate our approach to quantifying behavior: targeting aspects of behavior that are shown to be actively managed by the animal, and using measures that are discriminative across strains and treatments and replicable across laboratories.


Conflict of interest statement

The authors declare no conflict of interest.

Figures
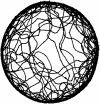
Fig. 1.
Fig. 1.
Path plot of a selected 30-min mouse session of forced exploration.
Fig. 2.
Fig. 2.
The proportion of mouse body area extending into the arena as a function of time. The vertical lines that follow runs of zeroes, where the mouse is entirely out of the arena, parse the time series into separate peep and hide motions. The maximal proportion of body extending into the arena throughout a motion is recorded as the extent of the peep and hide motion.
Fig. 3.
Fig. 3.
Two selected examples of sequences of repeated borderline roundtrips leading to the occupancy of the entire circumference of the arena. Upper: The first 27 roundtrips of a selected C57BL/6 mouse session. Lower: The first 57 roundtrips of a selected BALB/c mouse session. Doorway is located at 6 o'clock. Yellow to red indicates roundtrip's direction, gray represents path history, blue represents arena wall.
Fig. 4.
Fig. 4.
Quantifying the buildup in angular amplitude during successive borderline roundtrips in the main direction of the mouse's exploration. A 10-roundtrip-long window is being moved along the roundtrip ordinal number, with an 80% window overlap, and the 90th percentile in each window is estimated (full green circles). A threshold is chosen (20%, horizontal line), and the point where the LOESS-smoothed percentile function (smooth line in red) reaches the prescribed threshold is calculated, determining both the time to reach the threshold (in terms of number of borderline roundtrips; vertical line) and the rate estimated by the slope of the smoothed percentile function there (in terms of percent of full circle per roundtrip; blue line).
Fig. 5.
Fig. 5.
Quantitative comparison of the rate of growth of the maximal angular amplitude reached during successive borderline roundtrips in the two strains. Left: Smoothed percentile functions for all mice (pink for C57BL/6, blue for BALB/c) and the 20% threshold used (horizontal line). Upper Right: Box plots comparing the growth rates of the mice in the two groups (rates are measured as additional percent of circle covered per roundtrip). Lower Right: Box plots comparing the time to reach the threshold of the mice in the two groups (time is measured in terms of roundtrips performed). P values are for the significance of the difference in magnitude between the two strains by using Wilcoxon test.
Fig. 6.
Fig. 6.
Quantitative comparison of the rate of growth of the maximal distance from the wall reached during successive incursions between strains. Left: Smoothed percentile functions for all mice (pink for C57BL/6, blue for BALB/c) and the 20% threshold used (horizontal line). Upper Right: Box plots comparing the rates of growth of the mice in the two groups (measured as additional percent of radius covered per roundtrip). Lower Right: Box plots comparing the time to reach the threshold of the mice in the two groups (measured in incursions). P values are for the significance of the difference in magnitude between the two strains by using Wilcoxon test.
Fig. 7.
Fig. 7.
Four successive intervals of free exploratory behavior in a novel arena of a selected BALB/c mouse. A sequence of motion types, each represented by a distinct color within the top horizontal line, is composed of sequences of repeated motion, each represented within an especially dedicated horizontal line. As shown, the sequences emerge successively in a prescribed order. The sequence of sequences is represented in the bottom horizontal line by the first performance of each of the landmark motion types.
Fig. 8.
Fig. 8.
(A) Black: Density plot of the distribution of the maximal distances from wall of center segments (log-transformed) in a single C57BL/6J session. Red: Three Gaussian functions fitted to the distribution by the EM algorithm. The intersection points between the Gaussians serve as cutoff values for dividing all incursions performed in this session into three types. (B) Path plots of the incursions belonging to each type. (Used with permission from ref. 24).

References

    1. Hall CS. Emotional behavior in the rat: III. The relationship between emotionality and ambulatory activity. J Comp Psychol. 1936;22:345–352.
    1. Fonio E, Benjamini Y, Golani I. Freedom of movement and the stability of its unfolding in free exploration of mice. Proc Natl Acad Sci USA. 2009;106:21335–21340. - PMC - PubMed
    1. Benjamini Y, et al. Ten ways to improve the quality of descriptions of whole-animal movement. Neurosci Biobehav Rev. 2010;34:1351–1365. - PubMed
    1. Heinroth O, Heinroth K. The Birds. Ann Arbor: Univ Michigan Press; 1958.
    1. Lorenz K. In: Vergleichende verhaltensforschung. trans Lorenz KZ, Kickert RW, editors. Vienna: Springer-Verlag; 1978. (1981) The Foundations of Ethology (Springer-Verlag, New York)

Publication types

LinkOut - more resources