Review
. 2011 Sep 13;108 Suppl 3(Suppl 3):15565-71.
doi: 10.1073/pnas.1010868108. Epub 2011 Mar 7.

Searching for simplicity in the analysis of neurons and behavior

Affiliations
Review

Searching for simplicity in the analysis of neurons and behavior

Greg J Stephens et al. Proc Natl Acad Sci U S A. .

Abstract

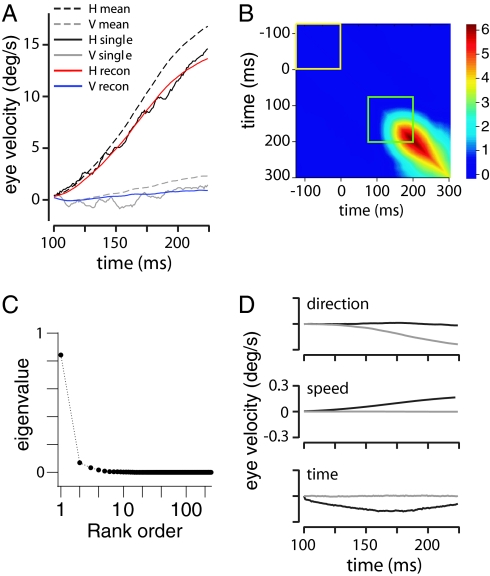
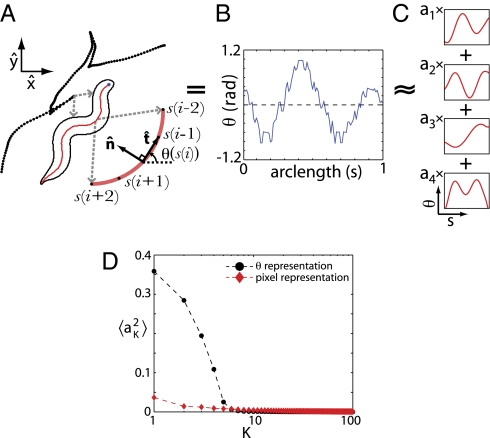
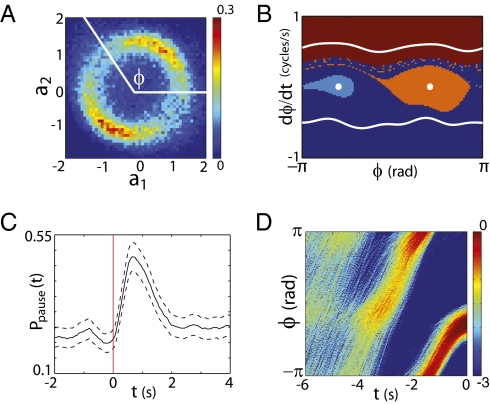
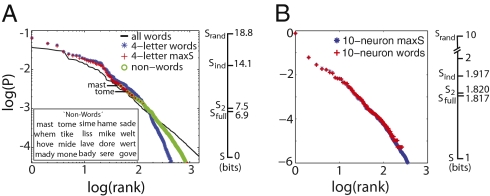
What fascinates us about animal behavior is its richness and complexity, but understanding behavior and its neural basis requires a simpler description. Traditionally, simplification has been imposed by training animals to engage in a limited set of behaviors, by hand scoring behaviors into discrete classes, or by limiting the sensory experience of the organism. An alternative is to ask whether we can search through the dynamics of natural behaviors to find explicit evidence that these behaviors are simpler than they might have been. We review two mathematical approaches to simplification, dimensionality reduction and the maximum entropy method, and we draw on examples from different levels of biological organization, from the crawling behavior of Caenorhabditis elegans to the control of smooth pursuit eye movements in primates, and from the coding of natural scenes by networks of neurons in the retina to the rules of English spelling. In each case, we argue that the explicit search for simplicity uncovers new and unexpected features of the biological system and that the evidence for simplification gives us a language with which to phrase new questions for the next generation of experiments. The fact that similar mathematical structures succeed in taming the complexity of very different biological systems hints that there is something more general to be discovered.


Conflict of interest statement

The authors declare no conflict of interest.

Figures

Fig. 1.
Fig. 1.
Low-dimensional dynamics of pursuit eye velocity trajectories (7). (A) Eye movements were recorded from male rhesus monkeys (Macaca mulatta) that had been trained to fixate and track visual targets. Thin black and gray lines represent horizontal (H) and vertical (V) eye velocity in response to a step in target motion on a single trial; dashed lines represent the corresponding trial-averaged means. Red and blue lines represent the model prediction. (B) Covariance matrix of the horizontal eye velocity trajectories. The yellow square marks 125 ms during the fixation period before target motion onset, the green square the first 125 ms of pursuit. The color scale is in deg/s2. (C) Eigenvalue spectrum of the difference matrix ΔC(t, t′) = Cpursuit(t, t′) (green square) − Cbackground(t, t′) (yellow square). (D) Time courses of the sensory error modes (vdir, vspeed, vtime). The sensory error modes are calculated from derivatives of the mean trajectory, as in Eq. 1, and linear combinations of these modes can be used to reconstruct trajectories on single trials as shown in A. These modes have 96% overlap with the significant dimensions that emerge from the covariance analysis in B and C and thus provide a nearly complete description of the behavioral variation. Black and gray curves correspond to H and V components.
Fig. 2.
Fig. 2.
Low-dimensional space of worm postures (15). (A) We use tracking video microscopy to record images of the worm's body at high spatiotemporal resolution as it crawls along a flat agar surface. Dotted lines trace the worm's centroid trajectory, and the body outline and centerline skeleton are extracted from the microscope image on a single frame. (B) We characterize worm shape by the tangent angle θ vs. arc length s of the centerline skeleton. (C) We decompose each shape into four dominant modes by projecting θ (s) along the eigenvectors of the shape covariance matrix (eigenworms). (D, black circles) Fraction of total variance captured by each projection. The four eigenworms account for ≈95% of the variance within the space of shapes. (D, red diamonds) Fraction of total variance captured when worm shapes are represented by images of the worm's body; the low dimensionality is hidden in this pixel representation.
Fig. 3.
Fig. 3.
Worm behavior in the eigenworm coordinates. (A) Amplitudes along the first two eigenworms oscillate, with nearly constant amplitude but time-varying phase ϕ = tan−1(a2/a1). The shape coordinate ϕ(t) captures the phase of the locomotory wave moving along the worm's body. (B) Phase dynamics from Eq. 3 reveals attracting trajectories in worm motion: forward and backward limit cycles (white lines) and two instantaneous pause states (white circles). Colors denote the basins of attraction for each attracting trajectory. (C) In an experiment in which the worm receives a weak thermal impulse at time t = 0, we use the basins of attraction of B to label the instantaneous state of the worm's behavior and compute the time-dependent probability that a worm is in either of the two pause states. The pause states uncover an early-time stereotyped response to the thermal impulse. (D) Probability density of the phase [plotted as log P(ϕ|t)], illustrating stereotyped reversal trajectories consistent with a noise-induced transition from the forward state. Trajectories were generated using Eq. 3 and aligned to the moment of a spontaneous reversal at t = 0.
Fig. 4.
Fig. 4.
For networks of neurons and letters, the pairwise maximum entropy model provides an excellent approximation to the probability of network states. In each case, we show the Zipf plot for real data (blue) compared with the pairwise maximum entropy approximation (red). Scale bars to the right of each plot indicate the entropy captured by the pairwise model. (A) Letters within four-letter English words (28). The maximum entropy model also produces “nonwords” (Inset, green circles) that never appeared in the full corpus but nonetheless contain realistic phonetic structure. (B) Ten neuron patterns of spiking and silence in the vertebrate retina (36).
Fig. 5.
Fig. 5.
Metastable states in the energy landscape of networks of neurons and letters. (A) Probability that the 40-neuron system is found within the basin of attraction of each nontrivial locally stable state Gα as a function of time during the 145 repetitions of the stimulus movie. Inset: State of the entire network at the moment it enters the basin of G5, on 60 successive trials. (B) Energy landscape (ε = −In P) in the maximum entropy model of letters in words. We order the basins in the landscape by decreasing probability of their ground states and show the low energy excitations in each basin.

References

    1. Nelson WL. Physical principles for economies of skilled movements. Biol Cybern. 1983;46:135–147. - PubMed
    1. d'Avella A, Bizzi E. Low dimensionality of supraspinally induced force fields. Proc Natl Acad Sci USA. 1998;95:7711–7714. - PMC - PubMed
    1. Santello M, Flanders M, Soechting JF. Postural hand synergies for tool use. J Neurosci. 1998;18:10105–10115. - PMC - PubMed
    1. Sanger TD. Human arm movements described by a low-dimensional superposition of principal components. J Neurosci. 2000;20:1066–1072. - PMC - PubMed
    1. Ingram JN, Körding KP, Howard IS, Wolpert DM. The statistics of natural hand movements. Exp Brain Res. 2008;188:223–236. - PMC - PubMed

Publication types

LinkOut - more resources