Review
. 2011 Sep 13;108 Suppl 3(Suppl 3):15588-95.
doi: 10.1073/pnas.1012178108. Epub 2011 Mar 7.

Understanding vision in wholly empirical terms

Affiliations
Review

Understanding vision in wholly empirical terms

Dale Purves et al. Proc Natl Acad Sci U S A. .

Abstract

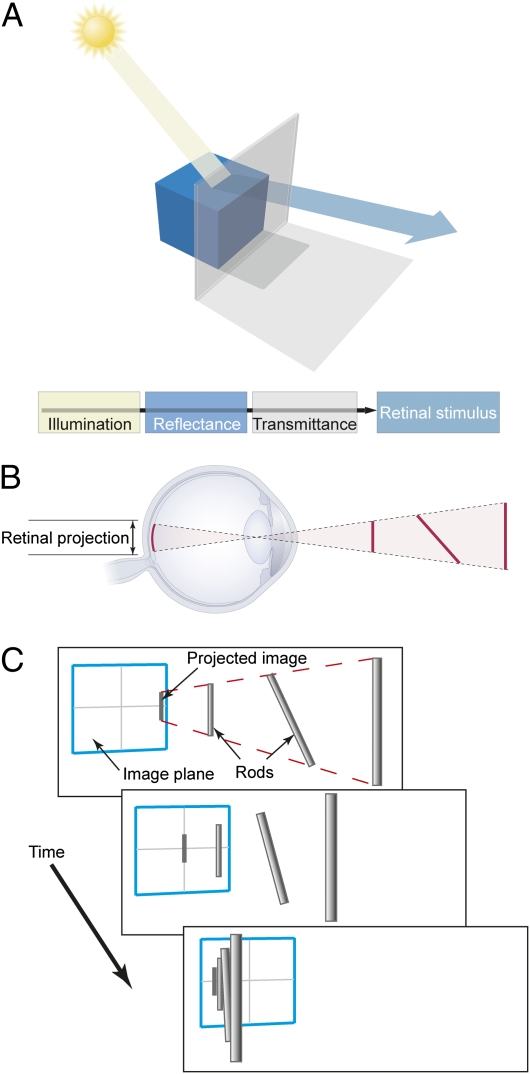
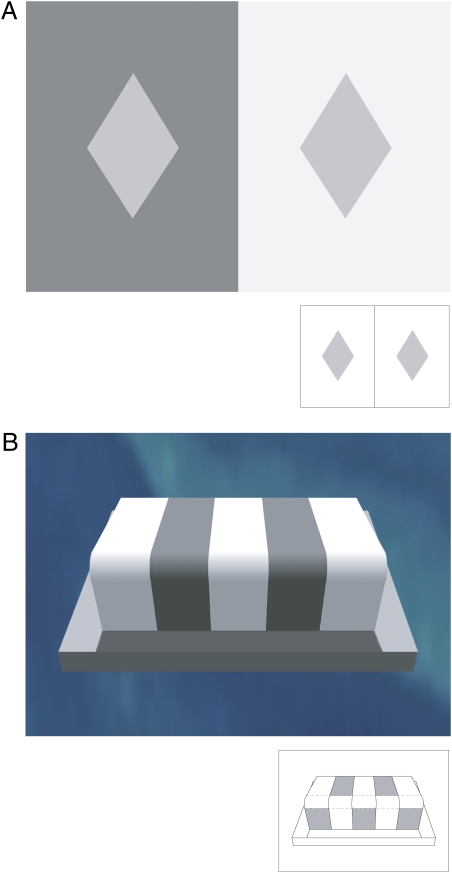
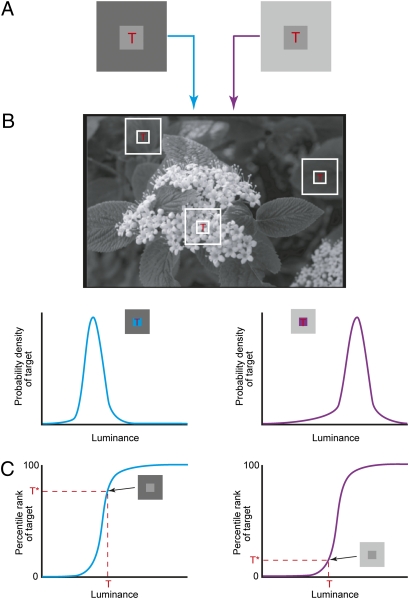
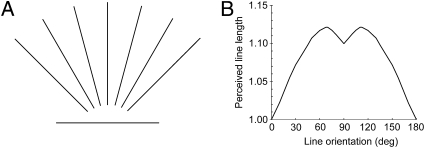
This article considers visual perception, the nature of the information on which perceptions seem to be based, and the implications of a wholly empirical concept of perception and sensory processing for vision science. Evidence from studies of lightness, brightness, color, form, and motion all indicate that, because the visual system cannot access the physical world by means of retinal light patterns as such, what we see cannot and does not represent the actual properties of objects or images. The phenomenology of visual perceptions can be explained, however, in terms of empirical associations that link images whose meanings are inherently undetermined to their behavioral significance. Vision in these terms requires fundamentally different concepts of what we see, why, and how the visual system operates.


Conflict of interest statement

The authors declare no conflict of interest.

Figures

Fig. 1.
Fig. 1.
The inverse optics problem. (A) The conflation of illumination, reflectance, and transmittance in retinal images. Many combinations of these physical characteristics of the world can generate the same retinal stimulus. (B) The conflation of physical geometry in images. The same image can be generated by objects of different sizes, at different distances from the observer, and in different orientations. (C) The conflation of speed and direction in images of moving objects. The same projected motion on the retina can be generated by different objects with various orientations moving in different directions and at different speeds in the physical world.
Fig. 2.
Fig. 2.
Discrepancies between luminance and perceptions of lightness and brightness. (A) Standard demonstration of the simultaneous brightness contrast effect. A target (the diamond) on a less luminant background (Left) is perceived as being lighter or brighter than the same target on a more luminant background (Right), even though the two targets have the same measured luminance; if both targets are presented on the same background, they appear to have the same lightness or brightness (Inset). (B) Although the gray target patches again have the same luminance and appear the same in a neutral setting (Inset), a striking perceptual difference in lightness is generated by contextual information that one set of patches is in shadow (those on the riser of the step) and another set in light (those on the surface of the step). [Reprinted with permission from ref. (Copyright 2003, Sinauer Associates)].
Fig. 3.
Fig. 3.
Predicting the perception of lightness or brightness by the frequency of target and context luminance values in stimuli generated by the world [explanation in the text; adapted from Yang and Purves (7)].
Fig. 4.
Fig. 4.
Variation in apparent line length as a function of orientation. (A) The horizontal line in this figure looks somewhat shorter than the vertical or oblique lines, despite the fact that all of the lines have the same measured length. (B) The apparent length of a line reported by subjects as a function of its orientation in the retinal image (expressed as the angle between the line and the horizontal axis). The maximum length seen by observers occurs when the line is oriented ∼30° from vertical, at which point it appears about 10–15% longer than the minimum length seen when the orientation of the stimulus is horizontal. The data shown here is an average of psychophysical results reported in the literature (15, 16).
Fig. 5.
Fig. 5.
The frequency of occurrence of lines projected onto the retina in different orientations determined by laser range scanning of typical environments. (A) Probability of the physical sources capable of generating lines of different lengths and orientations (θ) in the retinal image. (B) Cumulative probability distributions calculated from the distributions in A. The cumulative values for any given point on the abscissa are obtained by calculating the area underneath the curves in A that lie to the left of a line of that length in the relevant distribution. This value indicates how many lines in that orientation in retinal images have been shorter than the projected line in question and how many have been longer. (C) The predicted function for projected lines 6 pixels in length in different orientations derived from the cumulative probability distribution in B. The predicted function in C is similar to the psychophysical function of perceived line lengths in Fig. 4B (15, 16).
Fig. 6.
Fig. 6.
Discrepancies between physical and perceived speeds. (A) The flash-lag effect. When a flash of light (asterisk) is presented in alignment with a moving object (the red bar; Left), the flash is seen lagging behind the position of the object (Center). The apparent lag increases as the speed of the moving object increases (Right). The amount of lag as a function of object speed can be determined by asking subjects to align the flash with their perception of the moving stimulus at various object speeds. (B) Psychophysical function describing the flash-lag effect for image speeds up to 50°/s. The curve is a logarithmic fit to the lag reported by 10 observers. Bars are ±1 SEM. (C) Plotting the perceived lag reported by observers in B against the percentile ranking of image speeds from the motion database illustrates the correlation between both sets of data. The deviation from a linear fit (dashed line) indicates that >97% of the observed data are accounted for on an empirical basis [adapted from Wojtach et al. (28)].

References

    1. Palmer S. Vision Science: From Photons to Phenomenology. Cambridge, MA: MIT Press; 1999.
    1. Hubel DH, Wiesel TN. Brain and Visual Perception. New York: Oxford University Press; 2005.
    1. Purves D, Lotto B. Why We See What We Do Redux: A Wholly Empirical Theory of Vision. Sunderland, MA: Sinauer Associates; 2011.
    1. Gelb A. Die “Farbenkonstanz” der Sehdinge. In: von Bethe WA, von Bergmann G, Embden G, Ellinger A, editors. Handbuch der normalen und pathologischen Physiologie. Berlin: Springer; 1929. pp. 594–678.
    1. Gilchrist AL. Seeing in Black and White. Oxford: Oxford University Press; 2009.

LinkOut - more resources