. 2011 Mar 22;108(12):4846-51.
doi: 10.1073/pnas.1102714108. Epub 2011 Mar 7.

Dynamics of endosomal sorting complex required for transport (ESCRT) machinery during cytokinesis and its role in abscission

Affiliations

Dynamics of endosomal sorting complex required for transport (ESCRT) machinery during cytokinesis and its role in abscission

Natalie Elia et al. Proc Natl Acad Sci U S A. .

Abstract

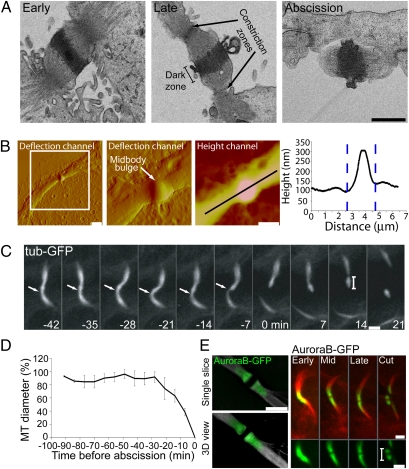
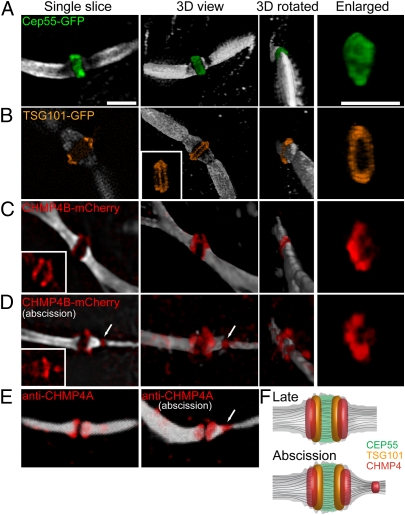
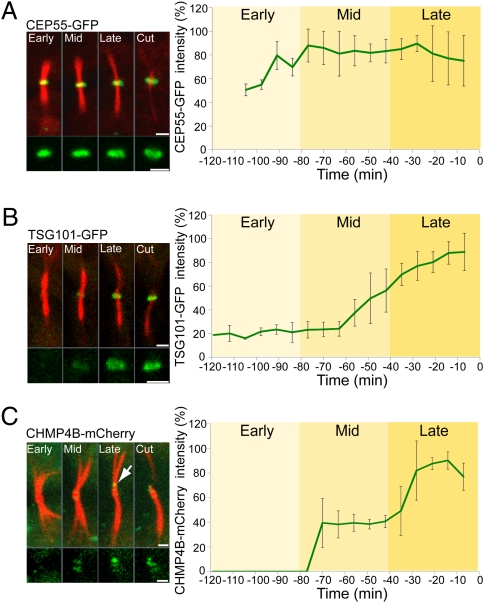
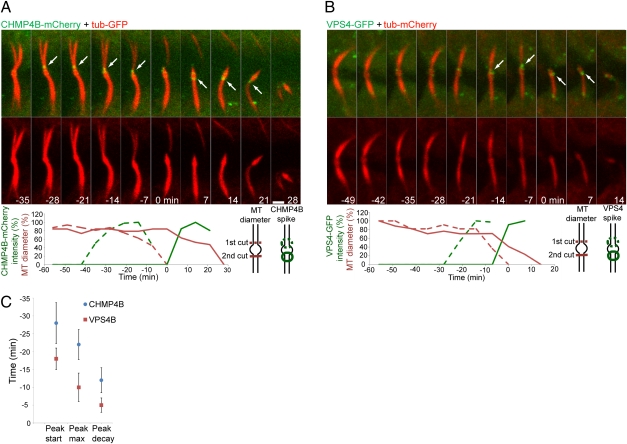
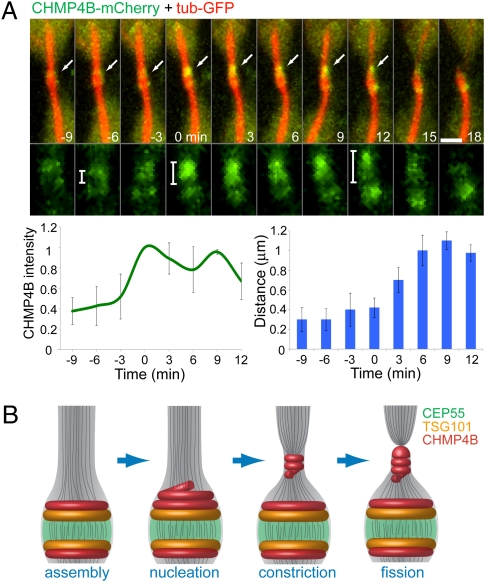
The final stage of cytokinesis is abscission, the cutting of the narrow membrane bridge connecting two daughter cells. The endosomal sorting complex required for transport (ESCRT) machinery is required for cytokinesis, and ESCRT-III has membrane scission activity in vitro, but the role of ESCRTs in abscission has been undefined. Here, we use structured illumination microscopy and time-lapse imaging to dissect the behavior of ESCRTs during abscission. Our data reveal that the ESCRT-I subunit tumor-susceptibility gene 101 (TSG101) and the ESCRT-III subunit charged multivesicular body protein 4b (CHMP4B) are sequentially recruited to the center of the intercellular bridge, forming a series of cortical rings. Late in cytokinesis, however, CHMP4B is acutely recruited to the narrow constriction site where abscission occurs. The ESCRT disassembly factor vacuolar protein sorting 4 (VPS4) follows CHMP4B to this site, and cell separation occurs immediately. That arrival of ESCRT-III and VPS4 correlates both spatially and temporally with the abscission event suggests a direct role for these proteins in cytokinetic membrane abscission.


Conflict of interest statement

The authors declare no conflict of interest.

Figures

Fig. 1.
Fig. 1.
Anatomical characteristics of the intercellular bridge during cytokinesis. (A) EM sections of the intercellular bridge from MDCK cells at early to late stages in cytokinesis (left to right) shows that the midbody dark zone (1 μm in diameter and 0.6 μm in width) is separated by constriction zones (arrows) that are 2 μm apart and has a diameter of 0.1–0.5 μm. (Scale bar: 1 μm.) (B) AFM of the intercellular bridge from MDCK cells in cytokinesis. Shown are deflection channels of the same midbody in different scales and a height channel of the zoomed in image. A height profile along the intercellular bridge indicates two constriction zones that are 2 μm apart and are 150–200 nm below the highest point of the midbody. (Scale bars: Left, 5 μm; Right. 2 μm.) (C) Live MDCK cells expressing α-tubulin–GFP during cytokinesis. The length of the midbody remnant (see bar) as measured by the fluorescent intensity profile is 2.18 ± 0.35 μm (n = 17) (Scale bar: 2 μm). (D) The relative change in microtubule diameter over time during cytokinesis at the position indicated by the arrow. Microtubule diameter was normalized to the maximal diameter measured for each cell. Abscission time (time 0) was defined as the time of the first breakage of the microtubule bridge. n = 17. (E) (Left) SIM images of the intercellular bridge of MDCK cells expressing AuroraB-GFP. (Right) Live-cell imaging of cells expressing AuroraB-GFP (green) together with α-tubulin–mCherry (red) during cytokinesis. n = 4. (Scale bars: 2 μm.)
Fig. 2.
Fig. 2.
Spatial organization of the ESCRT complex in the midbody determined by SIM. MDCK cells expressing CEP55-GFP (A), TSG101-GFP (B), or CHMP4B-mCherry (C and D) were synchronized, fixed, stained with anti–α-tubulin antibodies, and imaged by SIM. (AD) Each panel shows (from left to right) a single slice, a 3D rendering, a 3D rendering rotated 90°, and a zoomed-in image of the structure. Microtubules are colored in white, CEP55-GFP in green, TSG101-GFP in orange, and CHMP4B-mCherry in red. (A) CEP55 form a diffusely filled structure that is 1.4 ± 0.15 μm in diameter and 0.75 ± 0.07 μm in width. n = 10. A similar structure was observed for MKLP1 (Fig. S3A). (Scale bar: 2 μm.) (B) TSG101 forms a tightly packed double-ring structure surrounding the microtubules at the center of the midbody dark zone (width = 0.82 ± 0.03 μm). The rings are 1.7 ± 0.07 μm in their outer diameter and are 0.23 ± 0.02 μm apart. (Inset) A rotated image demonstrating the existence of two separate rings (n = 5). (C and D) CHMP4B concentrates in two broken rings that are 0.43 ± 0.08 μm apart. The diameter of each broken ring is 1.25 ± 0.18 μm. In some cells CHMP4B also shows an additional pool that is located asymmetrically 1.2 μm away from the center of the dark zone (arrow in D) and is perfectly colocalized to the site of microtubule constriction. (Insets) CHMP4B signal alone (n = 14). The average diameter of the microtubules in all the measurements (excluding D) is 0.98 ± 0.12 μm. The larger diameter measured for the proteins localized to the dark zone correlates with the diameter measured for this area using a membrane marker (1.6 μm; Fig. S3). The dark zone (the zone of no microtubule staining) is 0.7 ± 0.1 μm in width. (E) Confocal 3D-rendered images of antibody staining of endogenous CHMP4A (red) and tubulin (white) on the intercellular bridge of dividing MDCK cells. Images are consistent with the CHMP4B-mCherry localization described by SIM (D). (F) A model for ESCRT organization at the midbody integrating the SIM measurements indicated above.
Fig. 3.
Fig. 3.
Live-cell imaging of MDCK cells undergoing cytokinesis reveals sequential recruitment of the ESCRT components to the midbody bulge. Cells expressing low levels of CEP55-GFP (A), TSG101-GFP (B), and CHMP4B-mCherry (C) together with α-tubulin–mCherry (A and B) or α-tubulin–GFP (C) imaged using a spinning-disk confocal microscope at 7-min intervals. Each panel shows maximum intensity projection merged images of the microtubules (red) and the protein specified (green) in different stages during cytokinesis. Maximum intensity projections of the protein of interest alone are shown below. Intensities above background were measured from the sum intensity projection at each time point and are plotted to the right of each panel. Background intensities or lower were set as 0. Time 0 was determined as the time of the first microtubule breakage. The arrow in C indicates the site of acute increase in CHMP4B signal. The mean times for cytokinesis in the cells analyzed were CEP55, 89 ± 9 min (A); TSG101, 105 ± 12 min (B); and CHMP4B, 102 ± 16 min (C). These values are in the normal range for cytokinesis in MDCK cells, which is defined as abscission within 110 ± 30 min (as measured in 50 MDCK cells stably expressing α-tubulin–GFP). The double-ring structure observed for TSG101 by SIM could not be resolved here because it is below the optical resolution of this system. n = 8. (Scale bars: 2 μm.)
Fig. 4.
Fig. 4.
Acute increases in CHMP4B and VPS4B levels at the constriction site are tightly correlated in time with acute constriction of the microtubule bridge. MDCK cells expressing CHMP4B-mCherry (green) and α-tubulin–GFP (red) (A) or VPS4B-GFP (green) and α-tubulin–mCherry (red) (B) were imaged during cytokinesis. The images shown are sequential frames of the last steps of abscission. (A and B Upper) The upper rows show an overlay of CHMP4B (A) or VPS4B (B) on the microtubule signal; the lower rows show the tubulin signal alone. (A and B Lower) Plots of the change in microtubule diameter and fluorescence intensity of CHMP4B (A) or VPS4B (B) in the constriction zones (see diagrams at right of graph). (Scale bar: 2 μm.) (C) The average peak time of CHMP4B and VPS4B in the constriction zones relative to the abscission event (time 0) is plotted. n = 5.
Fig. 5.
Fig. 5.
Suggested model for ESCRT-mediated abscission. (A) MDCK cells expressing CHMP4B-mCherry (green) and α-tubulin–GFP (red) were imaged during late cytokinesis at 3-min intervals. (Upper) The images shown are sequential frames of the merged image (upper row) and the CHMP4B channel alone (lower row). (Scale bars: 2 μm.) (Lower Left) The graph shows the change in CHMP4B intensity on the side that is about to break. (Lower Right) The graph shows the distance between the highest-intensity CHMP4B pixel and the lowest-intensity CHMP4B pixel (located between the two initial rings) measured from a line intensity profile plotted along the midbody bridge on the side that is about break. This measurement was used as an indication of the location of the second CHMP4B pool relative to the center of the midbody. Time 0 was determined as the time CHMP4B intensity reached its maximal value. n = 5. (B) Suggested model for ESCRT-mediated constriction and fission during cytokinetic abscission. Assembly of CEP55 (green), TSG101 (yellow), and CHMP4B (red) at the midbody center forms a platform for initiation of abscission. Closer to abscission, ESCRTIII levels increases at the midbody and then relocalizes to the constriction zones, probably by polymerizing into a spiral. This relocalization induces constriction that is followed by breakage of the intercellular bridge, leading to complete separation of the two daughter cells.

References

    1. Glotzer M. The molecular requirements for cytokinesis. Science. 2005;307:1735–1739. - PubMed
    1. Eggert US, Mitchison TJ, Field CM. Animal cytokinesis: From parts list to mechanisms. Annu Rev Biochem. 2006;75:543–566. - PubMed
    1. Steigemann P, Gerlich DW. Cytokinetic abscission: Cellular dynamics at the midbody. Trends Cell Biol. 2009;19:606–616. - PubMed
    1. Sagona AP, Stenmark H. Cytokinesis and cancer. FEBS Lett. 2010;584:2652–2661. - PubMed
    1. Mullins JM, Biesele JJ. Terminal phase of cytokinesis in D-98s cells. J Cell Biol. 1977;73:672–684. - PMC - PubMed

Publication types

MeSH terms

Substances