

Mapping corpus callosum morphology in twin pairs discordant for bipolar disorder
- PMID: 21383237
- PMCID: PMC3169664
- DOI: 10.1093/cercor/bhr030
Mapping corpus callosum morphology in twin pairs discordant for bipolar disorder
Abstract
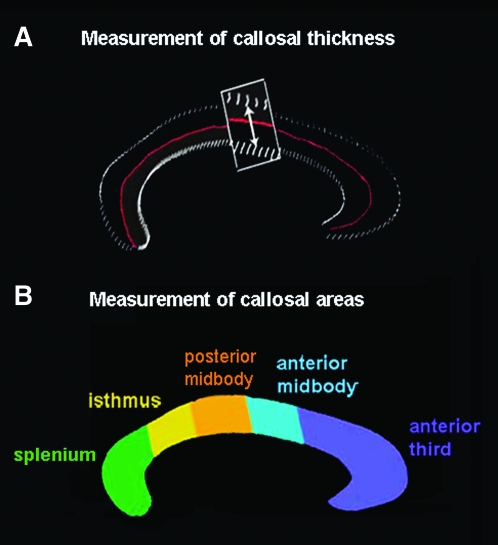
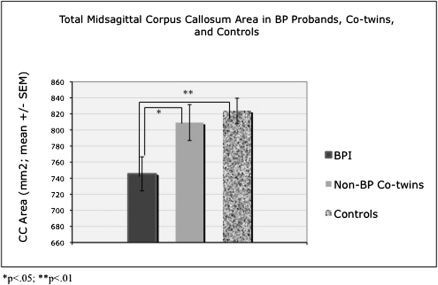
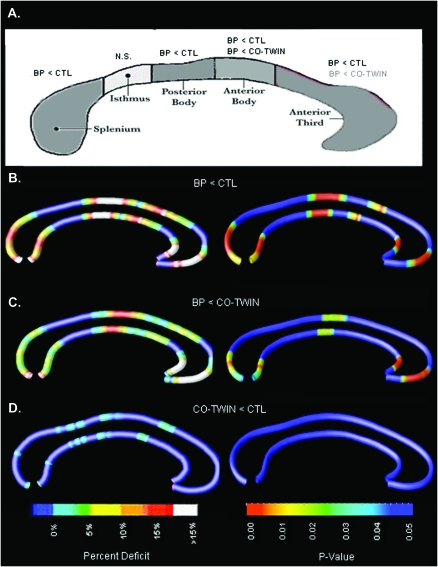
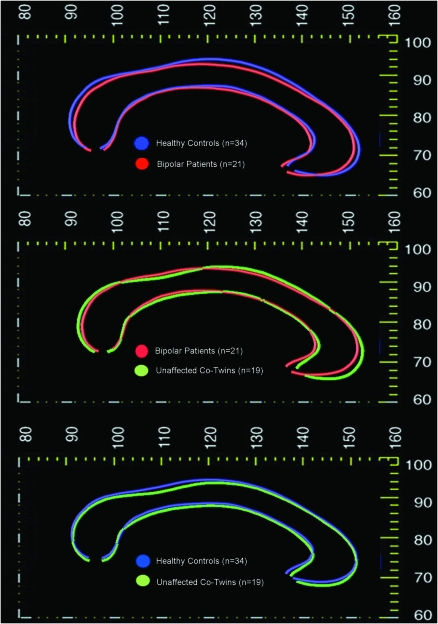
Callosal volume reduction has been observed in patients with bipolar disorder, but whether these deficits reflect genetic vulnerability to the illness remains unresolved. Here, we used computational methods to map corpus callosum abnormalities in a population-based sample of twin pairs discordant for bipolar disorder. Twenty-one probands with bipolar I disorder (mean age 44.4 ± 7.5 years; 48% female), 19 of their non-bipolar co-twins, and 34 demographically matched control twin individuals underwent magnetic resonance imaging. Three-dimensional callosal surface models were created to visualize its morphologic variability and to localize group differences. Neurocognitive correlates of callosal area differences were additionally investigated in a subsample of study participants. Bipolar (BPI) probands, but not their co-twins, showed significant callosal thinning and area reduction, most pronounced in the genu and splenium, relative to healthy twins. Altered callosal curvature was additionally observed in BPI probands. In bipolar probands and co-twins, genu and splenium midsagittal areas were significantly correlated with verbal processing speed and response inhibition. These findings suggest that aberrant connections between cortical regions--possibly reflecting decreased myelination of white matter tracts--may be involved in bipolar pathophysiology. However, findings of callosal thinning appear to be disease related, rather than reflecting genetic vulnerability to bipolar illness.
Figures
References
-
- Adler CM, Holland SK, Schmithorst V, Wilke M, Weiss KL, Pan H, Strakowski SM. Abnormal frontal white matter tracts in bipolar disorder: a diffusion tensor imaging study. Bipolar Disord. 2004;6:197–203. - PubMed
-
- Ahearn EP, Steffens DC, Cassidy F, Van Meter SA, Provenzale JM, Seldin MF, Weisler RH, Krishnan KR. Familial leukoencephalopathy in bipolar disorder. Am J Psychiatry. 1998;155:1605–1607. - PubMed
-
- Altshuler LL, Curran JG, Hauser P, Mintz J, Denicoff K, Post R. T2 hyperintensities in bipolar disorder: magnetic resonance imaging comparison and literature meta-analysis. Am J Psychiatry. 1995;152:1139–1144. - PubMed
-
- American Psychiatric Association . Diagnostic and statistical manual of mental disorders. 3rd ed. Washington (DC): Author; 1987.
-
- Arnone D, McIntosh AM, Chandra P, Ebmeier KP. Meta-analysis of magnetic resonance imaging studies of the corpus callosum in bipolar disorder. Acta Psychiatr Scand. 2008;118:357–362. - PubMed
