. 2011 Apr;21(4):566-77.
doi: 10.1101/gr.104018.109. Epub 2011 Mar 7.

High resolution mapping of Twist to DNA in Drosophila embryos: Efficient functional analysis and evolutionary conservation

Affiliations

High resolution mapping of Twist to DNA in Drosophila embryos: Efficient functional analysis and evolutionary conservation

Anil Ozdemir et al. Genome Res. 2011 Apr.

Abstract

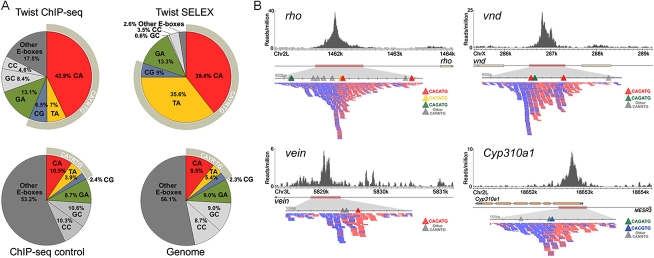
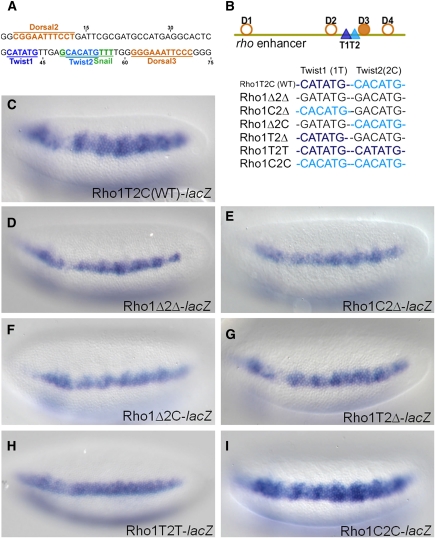
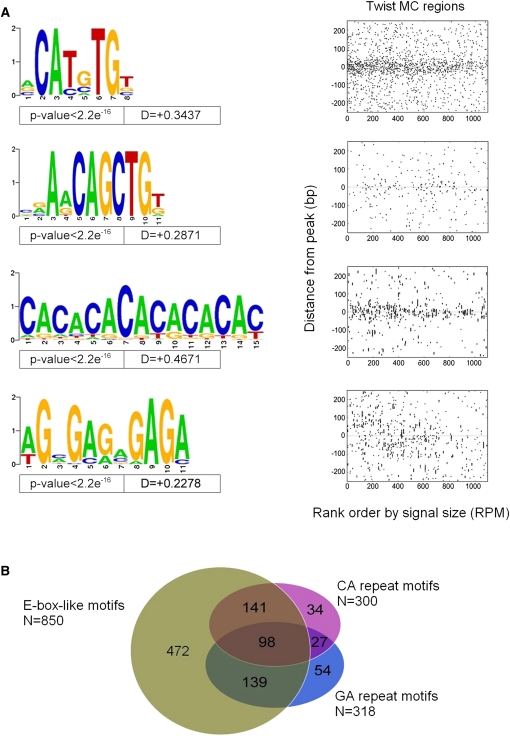
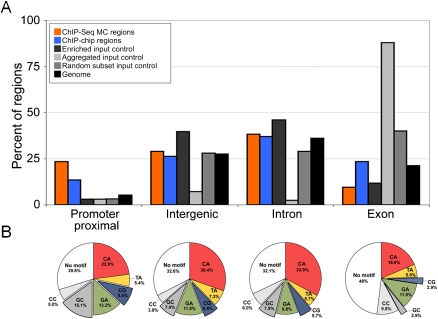
Cis-regulatory modules (CRMs) function by binding sequence specific transcription factors, but the relationship between in vivo physical binding and the regulatory capacity of factor-bound DNA elements remains uncertain. We investigate this relationship for the well-studied Twist factor in Drosophila melanogaster embryos by analyzing genome-wide factor occupancy and testing the functional significance of Twist occupied regions and motifs within regions. Twist ChIP-seq data efficiently identified previously studied Twist-dependent CRMs and robustly predicted new CRM activity in transgenesis, with newly identified Twist-occupied regions supporting diverse spatiotemporal patterns (>74% positive, n = 31). Some, but not all, candidate CRMs require Twist for proper expression in the embryo. The Twist motifs most favored in genome ChIP data (in vivo) differed from those most favored by Systematic Evolution of Ligands by EXponential enrichment (SELEX) (in vitro). Furthermore, the majority of ChIP-seq signals could be parsimoniously explained by a CABVTG motif located within 50 bp of the ChIP summit and, of these, CACATG was most prevalent. Mutagenesis experiments demonstrated that different Twist E-box motif types are not fully interchangeable, suggesting that the ChIP-derived consensus (CABVTG) includes sites having distinct regulatory outputs. Further analysis of position, frequency of occurrence, and sequence conservation revealed significant enrichment and conservation of CABVTG E-box motifs near Twist ChIP-seq signal summits, preferential conservation of ±150 bp surrounding Twist occupied summits, and enrichment of GA- and CA-repeat sequences near Twist occupied summits. Our results show that high resolution in vivo occupancy data can be used to drive efficient discovery and dissection of global and local cis-regulatory logic.


Figures

Figure 1.
Figure 1.
In vivo Twist occupancy supported by Twist ChIP-seq identifies functional CRMs. Representative examples of newly identified enhancers (brown boxes) and those previously identified (pink boxes) are shown for Cyp310a1 (A), mirr (B), Traf4 (C), and Mef2 (D). Upper left panels show ChIP-chip data and lower left panels show ChIP-seq data for Twist-IP and control samples. In upper right panels, lateral views of whole mount in situ hybridizations of the endogenous genes of stage 5–8 embryos are shown. In lower right panels, lateral views of whole mount in situ hybridizations of similar staged embryos containing either cherry (for Traf4, mirr, and Cyp310a1 enhancers) or lacZ (for Mef2 5′ enhancer) reporter constructs.
Figure 2.
Figure 2.
A comparison of Twist in vivo and in vitro binding preferences. (A) The frequency of E-boxes associated with HC twist peaks (±50 bp), SELEX-bound sequences, ChIP-seq enriched control regions (±50 bp of summits), and the non-repeat dm3 genome was calculated. (B) Twist ChIP-seq data in the vicinity of CRMs shown to support expression of the genes rho (Ip et al. 1992b), vnd (Stathopoulos et al. 2002), vein (Markstein et al. 2004), and Cyp310a1 (this work). The directionality within ChIP-seq sequencing reads points to the position of the “explanatory” site. Blue and red ticks symbolize individual sequencing reads acquired, which match either the Watson or Crick strand.
Figure 3.
Figure 3.
Motif composition of Twist ChIP-seq regions shows preferential concentration of specific E-boxes near summits. (A) Locations of CAYRTG = CACATG CATATG and CACGTG E-box instances located within ±250 bp of the ChIP-seq peak (ERANGE-shifted called signal summit; see Methods) (y axis), plotted as a function of signal intensity rank from highest (1) to lowest (2000) (x axis). 1099 MC ChIP-seq data set is shown with a dashed line. CACATG is the most prevalent E-box motif in Twist ChIP regions and it shows the strongest central concentration. (B) Direct (top panel) and cumulative (bottom panel) motif density plots. In the MC data set, 65% of CACATG motifs and 50% of CAGATG occur within ±50 bp of Twist peaks. (C) CAGATG occurs more frequently in Twist ChIP-seq regions and is more centrally localized than (D). (D) CATATG is the motif most prominent in SELEX data (see text). (E) Other E-boxes (defined here as CANNTG motifs where NN is neither CA, GA, nor TA) display a more uniform distribution (B,E), though the other CABVTG E-boxes not pictured here (CG, GC, and CC) provide a minor central enrichment (see Supplemental Fig. 8). The number and distribution of explanatory E-boxes changes with ChIP-seq signal strength, suggesting that more E-boxes create a more robust Twist ChIP signal (A; Supplemental Fig. 7).
Figure 4.
Figure 4.
Mutagenesis of Twist binding sites at the ChIP-seq peak summit of rho enhancer. (A) The 75 bp sequence from the rho minimal enhancer which contains binding sites for Twist as well as for the transcription factors Dorsal and Snail. E-box sequences CATATG (T1, dark blue) and CACATG (T2, light blue) are separated by 5 bp, and Dorsal binding sites (orange) are positioned upstream and downstream of Twist sites. A Snail site that overlaps with T2 E-box is shown in green. (B) A diagram of the minimal 299 bp rho enhancer showing the relative positions of sites for Twist (dark and light blue triangles) and Dorsal (orange circles and filled circles, showing non-canonical and canonical sites, respectively). Lower schematic shows color-coded representations of the WT or mutant Twist binding sites present in various reporter constructs. Single nucleotide mutations were introduced into either T1 or T2 to eliminate binding (black: CATATG>GATATG or CACATG>GACATG) or to convert one site to the other (light blue: CATATG>CACATG or dark blue: CACATG>CATATG). (C) In situ staining of the wild type construct, minimal rho enhancer attached to the evep.lacZ reporter. (D) The Rho1Δ2Δ double mutant containing point mutations in both of the E-boxes, T1 and T2, supports reporter gene expression that is significantly weakened and more narrow compared to wild type (C). (E–G) Single mutations support expression that is weaker than wild type (C), more similar to the double mutant (D). (H) When a CATATG E-box is present in both the T1 and T2 positions, this change severely affects the expression domain of the reporter gene, reducing it to levels comparable to those observed in the double mutant Rho1Δ2Δ embryos (D). (I) When a CACATG E-box is present in both the T1 and T2 positions, the expression supported is comparable to the wild type (C).
Figure 5.
Figure 5.
Motifs associated with Twist in vivo occupancy identified using MEME. MEME was run on the narrow 50 bp region surrounding each of the 1099 MC ChIP-seq peaks to identify all motifs that are enriched near the point of Twist occupancy. These motifs were mapped back to determine their spatial distribution relative to Twist peaks, and some motifs showing a non-uniform distribution near Twist peaks were selected. (A) Variations on CAYRTG and CAGCTG were returned, together specifying CABVTG (top two Weblogos). Note that a leading A residue or a lagging T residue is also suggested, which appears preferred by other non-Twist family DNA-binding bHLH factors (K Fisher-Aylor, S Kuntz, and A Kirilusha, unpubl. obs.; Grove et al. 2009). In addition, two simple repetitive sequences (CA and GA) are also significantly enriched at Twist-occupied sites (bottom two Weblogos). (B) Venn diagram illustrating the relationship between sets of peaks defined as having at least one occurrence of (i) either of the two E-box-like motifs; (ii) the CA-repeat-like sequence; or (iii) the GA-repeat-like sequence.
Figure 6.
Figure 6.
Enrichment of Twist ChIP-seq summits and explanatory E-box motifs in different genic and intergenic locations. (A) Enrichment of Twist ChIP-seq and ChIP-chip summits at particular positions in the genome, relative to a genome random sample and several sequencing negative controls. The genome was segregated into four mutually exclusive categories: promoter proximal (relative to the set of promoters from S. Celniker, including 500 bp upstream), exonic, intronic, and intergenic (see Supplemental Methods). While the majority of Twist regions fall into intergenic and intronic regions, there is a significant overabundance of Twist peaks in promoters relative to the amount of promoters in the genome (24%, or 258 of the ChIP-seq peaks). Intergenic and intronic Twist occurrences are comparable to that expected from a random genomic sample (29%, or 319 intergenic, and 38%, or 420 intronic). The number of summits within exonic regions is relatively disenriched (9%, or 102). In order to assess these numbers compared to expected values, we also compared the same number of Twist ChIP-chip regions (largest by area), the input control DNA regions enriched over Twist, the aggregated input DNA, and a random sampling of sequenced reads mapping uniquely to the genome (see Supplemental Text). We also report the total amount of the genome falling into each of these categories. The aggregated control and, to a lesser degree, the random control reads draw attention to the fact that there are many sequenced reads falling into exons. The enriched control does not show the exon bias perhaps because a directionality requirement was used; there is a mild enrichment of these sequences in the gene flanking category relative to the random genomic sample but a significant depletion in the promoter proximal that is likely due to the fact that Twist peaks are enriched at promoters. (B) The frequency of explanatory E-box sequences as a function of position of Twist-bound peaks in the genome (i.e., promoter proximal, intergenic, intronic, and exonic position). The CA, CG, and GA core E-boxes show enrichment in promoter, intergenic, and intronic positions; the GC core E-box is specifically enriched in the promoter proximal position.
Figure 7.
Figure 7.
Conservation analysis of sequences defined by Twist binding. (A) Averaged conservation profiles using phastCons scores for ChIP-seq regions and random genome samples. The blue curve shows average conservation in ChIP-seq peak regions is significantly elevated ±150–200 bp from the ChIP-seq signal summit. The green curve shows the same data but with regions recentered over the nearest CABVTG binding motif within 150 bp of the original summit. For the random sample, 500 regions containing one of the motifs were selected with the region start point selected at random for the uncentered distribution. Here “midpoint” refers to the location in the center of the randomly determined region. The error bar shows two standard deviations of 30 trials of 500 samples each. A maximum over the motifs is manifest, though substantially smaller than within the ChIP-seq peak regions. (B) Histogram of phastCons scores for bp occurring within the 6 E-box binding motif candidates (gray) compared to that for bp within the ChIP-seq regions, but outside any of the E-box motifs (black). Bp in the motif sites are found to be statistically more conserved than bp outside of motifs (0.005 significance level). (C) Fraction of sites in various sequence patterns falling within the top decile of phastCons scores for a 150 bp radius surrounding ChIP-seq summits versus the chi squared statistic for distributions within 150 bp of the summit compared to those of region 250–500 bp from the summit. CACATG, CATATG, and GA repeat sequences exhibit significantly greater conservation in ChIP-seq regions compared to flanking sequence than other motifs (as shown by their clustering at high values of the chi squared statistic), though CATATG and GA repeats do not exhibit high absolute levels of conservation.

References

    1. Arnosti DN, Kulkarni MM 2005. Transcriptional enhancers: Intelligent enhanceosomes or flexible billboards? J Cell Biochem 94: 890–898 - PubMed
    1. Auerbach RK, Euskirchen G, Rozowsky J, Lamarre-Vincent N, Moqtaderi Z, Lefrancois P, Struhl K, Gerstein M, Snyder M 2009. Mapping accessible chromatin regions using Sono-Seq. Proc Natl Acad Sci 106: 14926–14931 - PMC - PubMed
    1. Bailey TL, Williams N, Misleh C, Li WW 2006. MEME: Discovering and analyzing DNA and protein sequence motifs. Nucleic Acids Res 34: W369–373 (Web Server issue). - PMC - PubMed
    1. Bergman CM, Pfeiffer BD, Rincon-Limas DE, Hoskins RA, Gnirke A, Mungall CJ, Wang AM, Kronmiller B, Pacleb J, Park S, et al. 2002. Assessing the impact of comparative genomic sequence data on the functional annotation of the Drosophila genome. Genome Biol 3: RESEARCH0086 doi: 10.1186/gb-2002-3-12-research0086 - PMC - PubMed
    1. Berman BP, Nibu Y, Pfeiffer BD, Tomancak P, Celniker SE, Levine M, Rubin GM, Eisen MB 2002. Exploiting transcription factor binding site clustering to identify cis-regulatory modules involved in pattern formation in the Drosophila genome. Proc Natl Acad Sci 99: 757–762 - PMC - PubMed

Publication types

Associated data