. 2011 Apr;121(4):1608-23.
doi: 10.1172/JCI44911. Epub 2011 Mar 7.

Peripheral calcium-permeable AMPA receptors regulate chronic inflammatory pain in mice

Affiliations

Peripheral calcium-permeable AMPA receptors regulate chronic inflammatory pain in mice

Vijayan Gangadharan et al. J Clin Invest. 2011 Apr.

Abstract

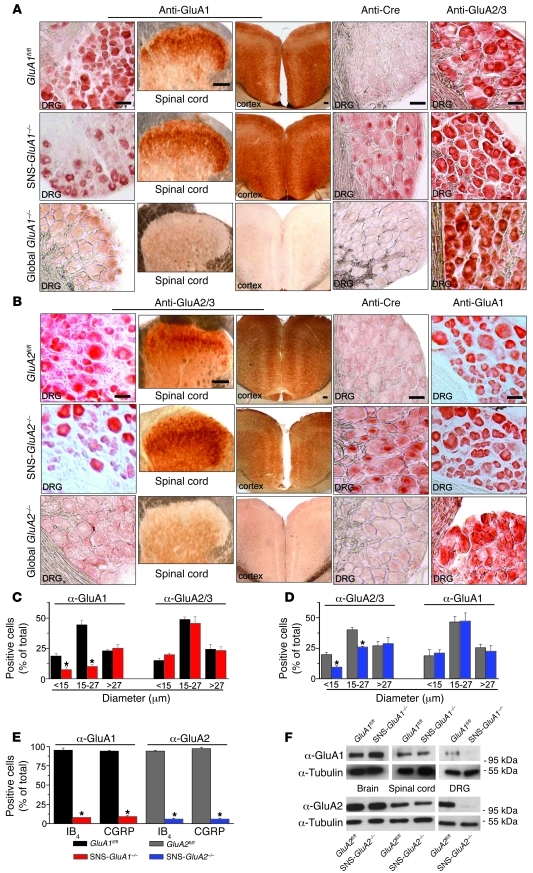
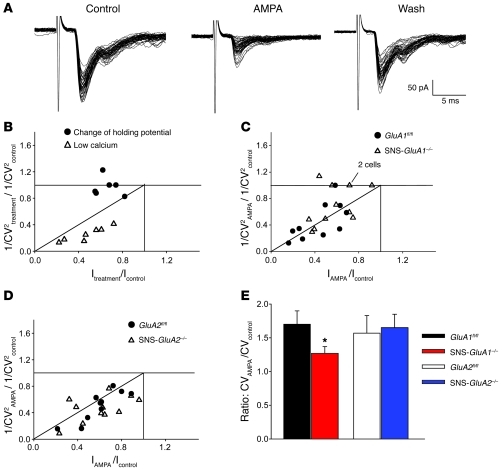
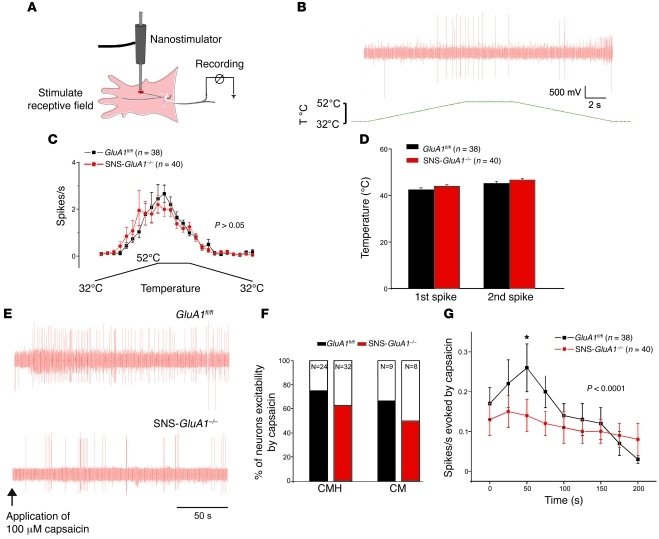
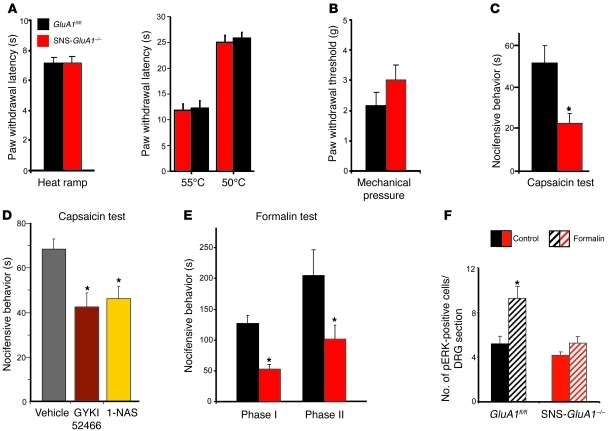
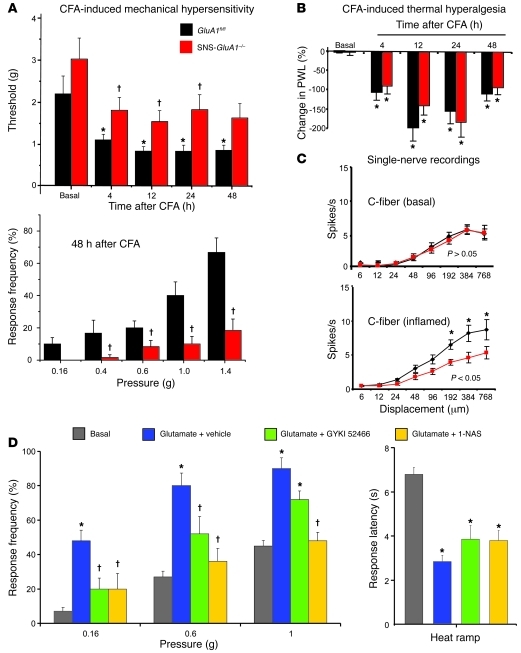
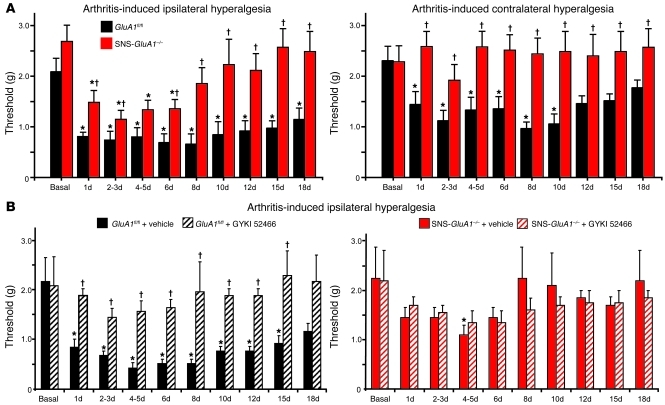
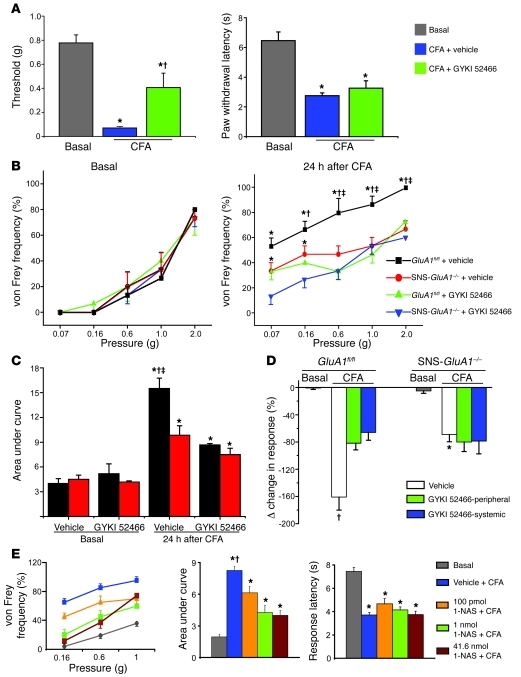
α-Amino-3-hydroxy-5-methyl-4-isoxazolepropionic acid-type (AMPA-type) glutamate receptors (AMPARs) play an important role in plasticity at central synapses. Although there is anatomical evidence for AMPAR expression in the peripheral nervous system, the functional role of such receptors in vivo is not clear. To address this issue, we generated mice specifically lacking either of the key AMPAR subunits, GluA1 or GluA2, in peripheral, pain-sensing neurons (nociceptors), while preserving expression of these subunits in the central nervous system. Nociceptor-specific deletion of GluA1 led to disruption of calcium permeability and reduced capsaicin-evoked activation of nociceptors. Deletion of GluA1, but not GluA2, led to reduced mechanical hypersensitivity and sensitization in models of chronic inflammatory pain and arthritis. Further analysis revealed that GluA1-containing AMPARs regulated the responses of nociceptors to painful stimuli in inflamed tissues and controlled the excitatory drive from the periphery into the spinal cord. Consequently, peripherally applied AMPAR antagonists alleviated inflammatory pain by specifically blocking calcium-permeable AMPARs, without affecting physiological pain or eliciting central side effects. These findings indicate an important pathophysiological role for calcium-permeable AMPARs in nociceptors and may have therapeutic implications for the treatment chronic inflammatory pain states.


Figures

Figure 1
Figure 1. Generation and characterization of mice lacking GluA1 or GluA2 in Nav1.8-expressing neurons (nociceptors) of the DRG.
(A) Immunohistochemistry with anti-GluA1, anti-Cre, and anti-GluA2/3 antibodies on sections of the DRG, spinal dorsal horn, and forebrain (anterior cingulate cortex is shown) of control mice (GluA1fl/fl mice), nociceptor-specific GluA1 knockout mice (SNS-GluA1–/– mice), and mice globally lacking GluA1 (GluA1–/– mice). (B) Immunohistochemistry with an antibody recognizing GluA2 and GluA3 (anti-GluA2/3) and anti-GluA1 and anti-Cre antibodies on sections of the DRG, spinal dorsal horn, and forebrain of control mice (GluA2fl/fl mice), nociceptor-specific GluA2 knockout mice (SNS-GluA2–/– mice), and mice globally lacking GluA2 (GluA2–/– mice). (A and B) Scale bars: 50 μm (DRG images); 100 μm (spinal cord and brain images). (C and D) Quantitative size frequency analysis of DRG neurons immunoreactive against anti-GluA1 or anti-GluA2/GluA3 confirms that small-diameter neurons lose and large-diameter neurons maintain expression of the respective genetically targeted subunits in (C) SNS-GluA1–/– mice and (D) SNS-GluA2–/– mice. (C) In contrast, anti-GluA2/GluA3 immunoreactivity is maintained in SNS-GluA1–/– mice, and (D) anti-GluA1 is maintained in SNS-GluA2–/– mice. (E) Dual immunofluorescence quantitative analysis of anti-GluA1 and anti-GluA2 with markers of peptidergic nociceptors (CGRP) and nonpeptidergic nociceptors (IB4) confirms a near complete loss of GluA1 in nociceptors of SNS-GluA1–/– mice and loss of anti-GluA2 in SNS-GluA2–/– mice. In CE, y axes represent immunopositive cells represented as a percentage of all cells counted in corresponding DRG sections. *P < 0.05 as compared to corresponding flox control mice. (F) Western blot analyses confirm DRG-specific deletion of GluA1 or GluA2 in SNS-GluA1–/– and SNS-GluA2–/– mice, respectively. Units for numbers in F are kDa. α-Tubulin represents a loading control.
Figure 2
Figure 2. Patch clamp analysis of AMPA-induced modulation of synaptic transmission between primary afferents and spinal dorsal horn neurons in SNS-GluA1–/– and SNS-GluA2–/– mice and their control littermates, GluA1fl/fl and GluA2fl/fl mice.
(A) Glutamatergic EPSCs recorded from a lamina II neuron obtained from a wild-type mouse. Application of AMPA (250 nM) caused a depression of EPSC, an increase of amplitude variability, and the appearance of some failures, which were reversed upon washing AMPA out. (BD) Plot data showing the ratio of CV-2 as a function of relative EPSC amplitude. Each symbol represents 1 neuron. (B) Graph representing CV changes in control experiments (low extracellular calcium and change of holding potential) mimicking presynaptic and postsynaptic modulations, respectively. 1/CV2treatment/1/CV2control represents the ratio between 1/coefficient of variation squared, obtained during treatment (either 1mM extracellular calcium or holding potential = –55 mV), and 1/coefficient of variation squared, measured in control (i.e., 2 mM extracellular calcium or holding potential = –85 mV). Itreatment/Icontrol represents the ratio between mean EPSC amplitude, measured during treatment (see above), and mean EPSC amplitude measured in control. (C and D) Effects of AMPA on EPSC amplitudes and CV values in wild-type, GluA1fl/fl, and SNS-GluA1–/– mutant mice. A subpopulation of neurons from SNS-GluA1–/– mice exhibited a pure postsynaptic modulation, since the CV remained constant in AMPA. 1/CV2AMPA/1/CV2control represents the ratio between 1/coefficient of variation squared, obtained during application of AMPA250 nM and 1/coefficient of variation squared, measured in control. IAMPA/Icontrol represents the ratio between mean EPSC amplitude, measured during AMPA application, and mean EPSC amplitude measured in control. (E) The ratio of CV in AMPA to CV in control is significantly lower in SNS-GluA1–/– mice, as compared with that in GluA1fl/fl mice (*P < 0.05, t test).
Figure 3
Figure 3. Electrophysiological analysis of peripheral nociceptive fiber responses to nociceptive stimuli in GluA1fl/fl mice and SNS-GluA1–/– mice.
(A) Scheme of the skin-saphenous nerve preparation and the recording setup (see Methods for details). (B and C) Analysis of responses of C-mechanoheat nociceptors to heat ramps. (B) A typical example of spike activity in response to a heat ramp. T, temperature. (C) Average spike activity from a population of nociceptors. (D) The threshold temperature for evoking first and second spikes. (EG) Analysis of responses of C-mechanoheat (C-MH) and C-mechano (CM) types of nociceptors to application of capsaicin (100 μM) to the receptive field in the skin. (E) Typical examples of capsaicin-evoked spikes in SNS-GluA1–/– and GluA1fl/fl mice. (F) Cumulative summary of the incidence of capsaicin-sensitive nociceptors. (G) Summary of the magnitude of capsaicin-evoked action potentials in nociceptors of SNS-GluA1–/– and GluA1fl/fl mice. No significant differences were seen between genotypes in C, D, and F. Two-way ANOVA for repeated measures revealed significant differences in the cumulative curves representing SNS-GluA1–/– and GluA1fl/fl mice (P < 0.001). *P < 0.05 for the time point indicated (post-hoc Bonferroni test).
Figure 4
Figure 4. Analysis of the basal excitability, activation properties, and calcium transients in the somata of nociceptive sensory neurons in SNS-GluA1–/– and GluA1fl/fl mice.
(A) Average resting membrane potential in nociceptive neurons identified via small cell size and humped action potential. (B) Typical example of action potentials (APs) generated by step-wise increments of current injection (threshold) and the average threshold current required to evoke action potentials. (C) Typical examples of the nature and frequency of action potentials evoked by prolonged current injections. (D and E) Input-output curves representing (D) the average latency to spiking and (E) the number of spikes in response to graded current injections. In AE, P > 0.05 between genotypes, 2-way ANOVA. (F) Typical examples of Fura-2–loaded dissociated DRG nociceptive neurons identified live via binding to IB4 (arrowheads). (G) Typical examples of traces of calcium transients represented as ratiometric change in fluorescence emission upon sequential excitation at 340 nm and 380 nm (F340/F380) prior to and after bath application of glutamate (3 mM), AMPA (10 μM) plus CTZ (20 μM), or KCl (25 mM, internal control). (H) Summary of the fraction of Fura-2–labeled IB4-positive DRG neurons responding to agonists (expressed as a percentage of total cells tested) over 9 to 10 independent culture experiments. (I) Average of peak ratiometric changes in cells that responded to glutamate and KCl in SNS-GluA1–/– mice (red bars) and GluA1fl/fl mice (black bars). (ΔF/F) X100 is the percentage increase of F340/F380 ratio over basal. *P < 0.05, ANOVA for random measures, Fisher’s post-hoc test.
Figure 5
Figure 5. Analysis of the contribution of peripheral AMPARs to the modulation of acute nociception and early nociceptive hypersensitivity.
(A) Latency of paw withdrawal after application of noxious heat in form of infrared heat ramp (left) or constant temperature (right) and (B) threshold of paw withdrawal to mechanical stimuli applied via the dynamic aesthesiometer is normal in SNS-GluA1–/– mice. (C) SNS-GluA1–/– mice show reduced duration of acute nocifensive behaviors in seconds, upon hind paw intraplantar injection of 0.06% capsaicin (n = 7–15 mice per group; *P < 0.05). (D) Capsaicin-induced nocifensive behaviors in wild-type mice are reduced upon peripheral pretreatment with a pan-antagonist of AMPARs, GYKI 52466, or a specific antagonist of calcium-permeable AMPARs, 1-NAS (n = 5 mice per group; *P < 0.05). (E) SNS-GluA1–/– mice show reduced duration of acute nocifensive behaviors (phase I) as well as early inflammatory hypersensitivity (phase II), upon hind paw intraplantar injection of 1% formalin (n = 7–15 mice per group; *P < 0.05 as compared with GluA1fl/fl mice). (F) Quantification of neuronal activation 1 hour after intraplantar formalin injection by means of counting pERK-positive neurons in DRG sections of SNS-GluA1–/– and control mice (n = 7–15 mice per group; *P < 0.05 as compared with the corresponding control mice). Data was analyzed via ANOVA for random measures, post-hoc Fischer’s test in E and F, and Student’s t test in AD.
Figure 6
Figure 6. Behavioral and electrophysiological analysis of hypersensitivity in SNS-GluA1–/– and GluA1fl/fl mice caused by intraplantar injection of CFA or glutamate (100 nmol).
(A) Summary of response thresholds (defined as a force eliciting a response frequency of at least 40%), and a comparison of response frequencies in response to plantar von Frey hair application. (B) Changes in paw withdrawal latency (PWL) in response to infrared heat in the inflamed paw represented as the percentage decrease over the contralateral uninflamed paw. (A and B) *P < 0.05 as compared with the corresponding basal states; P < 0.05 as compared with GluA1fl/fl mice; ANOVA for random measures, post-hoc Fisher’s test; n = 16 per genotype. (C) Firing frequencies in response to pressure applied via a nanomotor (expressed in terms of displacement) in the skin-nerve preparation. After inflammation, C-mechanoceptors showed potentiated responses in GluA1fl/fl mice but not in SNS-GluA1–/– mice (*P < 0.05, repeated measures ANOVA over the whole curve; *P < 0.05 between the 2 genotypes at the indicated points, post-hoc Bonferroni; n = 10–20 mice per group). (D) Peripherally administered GYKI 52466 as well as 1-NAS significantly blocked mechanical hypersensitivity, but not thermal hyperalgesia, evoked by intraplantar injection of glutamate. *P < 0.05 as compared with basal; P < 0.05 as compared with glutamate plus vehicle group; n = 5 mice per group. All data points represent mean ± SEM.
Figure 7
Figure 7. Analysis of arthritis-induced chronic pain hypersensitivity in GluA1fl/fl mice and SNS-GluA1–/– mice.
(A) Summary of response thresholds (defined as a force eliciting a response frequency of at least 40%) to von Frey hair application prior to (basal) and up to 18 days after induction of kaolin-induced unilateral knee arthritis in SNS-GluA1–/– mice (n = 12) and their GluA1fl/fl littermates (n = 12). Von Frey hairs were applied to the plantar surface of the hind paws ipsilateral and contralateral to the arthritic knee. (B) Systemic treatment with the AMPAR antagonist, GYKI 52466, once per day completely blocked the development and maintenance of mechanical hypersensitivity (ipsilateral values are shown) in GluA1fl/fl mice but not in SNS-GluA1–/– mice (n = 6 per group). (A and B) *P < 0.05 as compared with basal; P < 0.05 as compared with GluA1fl/fl mice.
Figure 8
Figure 8. Effects of peripheral application of a selective AMPAR antagonist (GYKI 52466, 5 nmol) and a selective antagonist of calcium-permeable AMPARs (1-NAS, 100 pmol, 1 nmol, and 41.6 nmol) on inflammatory hypersensitivity.
(A) In wild-type mice, the CFA-induced drop in mechanical response threshold (plantar von Frey) is attenuated by peripheral GYKI 52466 (left), whereas CFA-induced thermal hyperalgesia is not affected (right). *P < 0.05 as compared with basal values. P < 0.05 as compared to vehicle group. (B and C) Curves representing (B) response frequencies to graded von Frey hair stimulation and (C) corresponding integral values in the presence of GYKI 52466 or vehicle. (D) Analysis of mechanical hypersensitivity in the same cohorts of animals as in B and C using a dynamic aesthesiometer. CFA-induced mechanical hypersensitivity in the inflamed paw is represented as percentage decrease over the uninflamed paw. P < 0.05 as compared with GYKI 52466 group; *P < 0.05 as compared to vehicle treated GluA1fl/fl group. (B and C) *P < 0.05 as compared with corresponding basal value; P < 0.05 as compared with GYKI 52466 group; P < 0.05 as compared with SNS-GluA1–/– mice in the same group (GYKI 52466/vehicle); ANOVA followed by Fisher’s post-hoc test, n = 6–10 mice per group. (E) Effects of peripheral injection of 1-NAS on basal nociceptive sensitivity and CFA-induced hypersensitivity, expressed as shift in stimulus-response frequencies to plantar von Frey stimulation (left), the corresponding area under the curve (middle), and thermal hyperalgesia (right). 1-NAS dose-dependently attenuated CFA-induced mechanical hypersensitivity but not thermal hyperalgesia. *P < 0.05 as compared with corresponding basal value; P < 0.05 as compared with the 1-NAS group; ANOVA followed by Fisher’s post-hoc test, n = 5–10 mice per group.

Similar articles

Cited by

References

    1. Woolf CJ, Salter MW. Neuronal plasticity: Increasing the gain in pain. Science. 2000;288(5472):1765–1768. doi: 10.1126/science.288.5472.1765. - DOI - PubMed
    1. Malinow R, Malenka RC. AMPA receptor trafficking and synaptic plasticity. Annu Rev Neurosci. 2002;25:103–126. doi: 10.1146/annurev.neuro.25.112701.142758. - DOI - PubMed
    1. Seeburg PH, Single F, Kuner T, Higuchi M, Sprengel R. Genetic manipulation of key determinants of ion flow in glutamate receptor channels in the mouse. Brain Res. 2001;907(1–2):233–243. doi: 10.1016/S0006-8993(01)02445-3. - DOI - PubMed
    1. Burnashev N, Monyer H, Seeburg PH, Sakmann B. Divalent ion permeability of AMPA receptor channels is dominated by the edited form of a single subunit. Neuron. 1992;8(1):189–198. doi: 10.1016/0896-6273(92)90120-3. - DOI - PubMed
    1. Engelman HS, Allen TB, MacDermott AB. The distribution of neurons expressing calcium-permeable AMPAR in the superficial laminae of the spinal cord dorsal horn. J Neurosci. 1999;19(6):2081–2089. - PMC - PubMed

Publication types

MeSH terms