. 2011 Apr;121(4):1535-48.
doi: 10.1172/JCI44862. Epub 2011 Mar 7.

IL-2 induces a WAVE2-dependent pathway for actin reorganization that enables WASp-independent human NK cell function

Affiliations

IL-2 induces a WAVE2-dependent pathway for actin reorganization that enables WASp-independent human NK cell function

Jordan S Orange et al. J Clin Invest. 2011 Apr.

Abstract

Wiskott-Aldrich syndrome (WAS) is a primary immunodeficiency associated with an increased susceptibility to herpesvirus infection and hematologic malignancy as well as a deficiency of NK cell function. It is caused by defective WAS protein (WASp). WASp facilitates filamentous actin (F-actin) branching and is required for F-actin accumulation at the NK cell immunological synapse and NK cell cytotoxicity ex vivo. Importantly, the function of WASp-deficient NK cells can be restored in vitro after exposure to IL-2, but the mechanisms underlying this remain unknown. Using a WASp inhibitor as well as cells from patients with WAS, we have defined a direct effect of IL-2 signaling upon F-actin that is independent of WASp function. We found that IL-2 treatment of a patient with WAS enhanced the cytotoxicity of their NK cells and the F-actin content at the immunological synapses formed by their NK cells. IL-2 stimulation of NK cells in vitro activated the WASp homolog WAVE2, which was required for inducing WASp-independent NK cell function, but not for baseline activity. Thus, WAVE2 and WASp define parallel pathways to F-actin reorganization and function in human NK cells; although WAVE2 was not required for NK cell innate function, it was accessible through adaptive immunity via IL-2. These results demonstrate how overlapping cytoskeletal activities can utilize immunologically distinct pathways to achieve synonymous immune function.


Figures
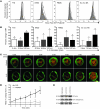
Figure 1
Figure 1. IL-2 promotes intracellular F-actin content in NK cells.
(A) YTS, NK92, PBMC, or ex vivo NK cells were treated with 125 U/ml of IL-2 for 30 minutes, fixed, permeabilized, and stained with phalloidin Alexa Fluor 647. Percentage of maximal fluorescence intensity of Alexa Fluor 647 is demonstrated for control (gray) and IL-2–treated (white) cells. In PBMCs, only the CD56+CD3 cells were selected. (B) Phalloidin MFI induced by IL-2 over that in control-treated cells according to time of in vitro IL-2 or vehicle exposure (error bars demonstrate SD; *P < 0.05 compared with control-treated cells). (C) Distribution of actin-GFP in control-treated (top) or IL-2–treated (bottom) YTS GFP-actin cells using real-time confocal microscopy. GFP-actin fluorescence is depicted in green, and DRAQ5 DNA dye (nuclear material) is depicted in red. Time = 0:00 represents the addition of IL-2 or vehicle to the imaging chamber. Scale bar: 5 μm. (D) Calculated change from time = 0:00 in mean area intensity of peripheral GFP-actin over the first 8 minutes in control-treated cells (gray triangles) compared with IL-2–treated cells (black squares). Each point represents the mean ± SD from 10 cells, and the IL-2 and control data sets are significantly different (P = 0.0023) via a 2-tailed Mann-Whitney U test. (E) Insoluble F-actin–rich cell fractions prepared from unstimulated, 10-minute, or 120-minute IL-2–stimulated YTS GFP-actin cells were evaluated by Western blot analysis for GFP-actin (top), endogenous actin (middle), and histone H1 (bottom). The numbers beneath the blots provide the densitometric ratio of the GFP or actin signal to that present in the unstimulated lane and are representative of 2 repeats.
Figure 2
Figure 2. IL-2 restores F-actin accumulation at and lytic granule polarization to the NK cell IS.
(A) Representative examples of the NK cell IS formed between resting or 30-minute IL-2–stimulated ex vivo NK cells obtained from either a control donor (control) or a WAS patient with a complete deletion of the WASP gene (WASPdel) with K562 target cells (additional examples in Supplemental Figure 3). Images show DIC (top panel) and confocal fluorescence microscopy for F-actin using phalloidin (yellow) and perforin (green) as well as an overlay of fluorescent channels. Scale bars: 5 μm. (B) Quantification of F-actin accumulation at the IS formed between K562 target cells and ex vivo NK cells of control (red), IL-2–activated control (orange), WASPdel patient (black), and IL-2–activated WASPdel patient (blue). Each spot represents the calculated F-actin accumulation value (see Methods for details) from a single cell; the horizontal bar represents the mean of all cells shown and the vertical bars ± SD. Significant differences among group means are shown. *P < 0.05; n ≥ 25. (C) Measurement of lytic granule polarization as the shortest distance from the centroid of the entire lytic granule region to the IS in each of the ex vivo NK cell–target cell combinations. Bar colors correspond to those used in B and display mean + SD. Mean distance in resting WASPdel patient ex vivo NK cells was different from that in the other cells measured. *P < 0.05; n ≥ 25.
Figure 3
Figure 3. IL-2 increases cytotoxicity and F-actin reorganization in wiskostatin-treated NK cells.
(A) Cytotoxic activity of YTS cells (left), NK92 cells (middle), or PBMCs (right) pretreated with vehicle control (c, black solid line), IL-2 (gray solid line), wiskostatin (Wisk, black dashed line), and wiskostatin followed by IL-2 (Wisk+IL-2, gray dashed line). Cells were incubated with IL-2 where specified for 30 minutes prior to the assay. K562 target cells were used for NK92, and 721.221 target cells for YTS and PBMCs. Cytotoxicity was measured by 4-hour 51Cr-release assays. Each point represents the mean of 5 individual assays, each performed in triplicate + SD. For each graph, decreases mediated by wiskostatin and increases in wiskostatin-treated cells mediated by IL-2 were significant (*P < 0.05, 2-tailed Mann-Whitney U test). (B) Change in F-actin content measured as percentage increase in phalloidin MFI via flow cytometry in YTS cells (left), NK92 cells (middle), or PBMCs (right). Vehicle control-treated cells were compared with IL-2–treated (black), wiskostatin-treated (gray), and wiskostatin- and IL-2–treated (white). Each bar represents the mean of 3 or more experiments ± SD (*P < 0.05, significant changes from control-treated cells). 30-minute wiskostatin pretreatment was followed by 30-minute IL-2 treatment. (C) Representative TEM images of platinum rotary-shadowed, sonicated, and extracted YTS cells that had been adhered to glass coated with CD18 and anti-CD28. Prior to adherence to the glass, cells were treated with vehicle (left), wiskostatin (center), or wiskostatin followed by IL-2 (right). Cortical F-actin network detail is shown. Original magnification, ×6000 (scale bar: 5 μm [top]) and ×30,000 (scale bar: 1 μm [bottom]).
Figure 4
Figure 4. Requirement for IL-2 signaling to rescue NK cell cytotoxicity from WASp inhibition.
YTS (A and B), NK92 (C and D), and ex vivo NK (E and F) cells were control (C, circles), wiskostatin (Wisk, squares), ZM 449829 (downward triangles), or wiskostatin and ZM 449829 (Wisk+ZM, upward triangles) treated prior to addition of media (solid black line) or IL-2 (dashed gray line) for 30 minutes. Each column of graphs depicts the effect of IL-2 (dashed line) added to the respective control or inhibitor-treated cells (solid line). The control cytotoxicity for all of the treatments is in the left-most graph (black circles). Cytotoxic activity of treated cells was measured against 721 or K562 target cells in 4-hour 51Cr-release assays. Individual points represent the mean of triplicates, and individual experiments are representative of 2–5 repeats. (B, D, F) A portion of the cells prepared for cytotoxicity was used to prepare whole-cell lysates, which were evaluated for the presence of phosphorylated (top) and total (bottom) STAT5 by Western blot analysis. Total STAT5 was detected using the same membrane used for phosphorylated STAT5 after stripping and reprobing. Numbers beneath each lane represent densitometric ratios for pSTAT5 to total STAT5.
Figure 5
Figure 5. In vivo IL-2 administration enhances NK cell cytotoxicity and F-actin content in a WAS patient ex vivo.
A patient with grade 2 WAS was enrolled and treated with subcutaneous IL-2 using 0.5 × 10⁶ U/m2/d × 5 d for each of 3 treatments as listed (A). Blood was drawn immediately prior to each treatment cycle as well as at the time points specified. (B) Examples of the local reactions noted at the IL-2 injection site. (C) NK cell cytotoxicity using patient PBMCs (dashed line) in 51Cr-release assay against K562 target cells from the initial screen (week –1) and the penultimate blood draw (week 23) compared with PBMC of an individual healthy donor (not treated with IL-2, solid line). (D) F-actin content in patient CD56dim (solid line) and CD56bright (dashed line) NK cells expressed as the MFI percentage of that identified in control over the course of the treatment protocol. The red and orange lines represent the CD56dim and CD56bright pretreatment values, respectively, and the open rectangles correspond to the 5-day periods of IL-2 administration.
Figure 6
Figure 6. In vivo IL-2 administration of IL-2 to a WAS patient restores F-actin accumulation at and lytic granule polarization to the lytic IS in NK cells.
(A) Representative images (from left to right) of the NK cell IS formed between an ex vivo NK cell from a control donor or the WAS patient prior to or after each of the 3 courses of IL-2 treatment and K562 target cell. A DIC image (top panel) and confocal fluorescence micrographs (bottom panels) depicting F-actin (phalloidin, yellow) and perforin (green) as well as an overlay of fluorescent channels. Scale bars: 5 μm. Quantitation of F-actin accumulation at (B) and polarization of the lytic granule region to the IS (C) in control donor (red) and patient before (black) as well as after the first (light green), second (dark green), and third (brown) IL-2 treatments as presented in Figure 2. Each mean represents 15 synapses ± SD and significant differences are noted. *P < 0.05.
Figure 7
Figure 7. IL-2 stimulation of NK cells induces WASp-independent WAVE2 phosphorylation.
YTS and ex vivo NK cells were pretreated with vehicle (C, control), wiskostatin (Wisk) and/or followed by IL-2 for 30 minutes. Whole-cell lysates of YTS (A) and ex vivo NK (B) cells were evaluated for WAVE2 by Western blot analysis. Membranes were stripped and reprobed for myosin-IIA as a loading control (bottom). Numbers beneath each lane represent densitometric ratios for WAVE2 protein normalized to loading control. (C) Supernatant of WAVE2 immunoprecipitate from YTS cells (treated as above) evaluated for the presence of phosphorylated and total STAT5. The WAVE2 immunoprecipitate from YTS (D and E) and ex vivo NK cells (F and G) was evaluated first for phosphoserine (top) by Western blot analysis; then the membrane was stripped and reprobed for WAVE2 (bottom). IgG immunoprecipitate (IgG) is included as a control for the WAVE2 (W2) immunoprecipitate. Numbers beneath each lane represent densitometric ratios for phosphorylated WAVE2 protein relative to control normalized to total WAVE2 content. Western blot analyses are representative of 3 independent experiments from which the mean densitometric ratios are shown graphically (E and G). Error bars show SD, and values significantly different from the mean in control-treated cells are noted (*P < 0.05). WAVE2 or IgG immunoprecipitate from (H) control, and (I) WASPdel patient NK cells (shown in Figure 2) that were pretreated with media control or IL-2 for 30 minutes was evaluated using Western blot analysis as for D and F.
Figure 8
Figure 8. Requirement for WAVE2 in IL-2–induced rescue of WASp inhibition in NK cells.
(A) YTS or (B) ex vivo NK cells nucleofected with control or WAVE2-specific siRNA for 24 hours were lysed and evaluated for the presence of WAVE2 (top) and β-actin expression by Western blot analysis. Nucleofected YTS (C, E, G) or ex vivo NK cells (D and F) were treated with wiskostatin or vehicle for 30 minutes followed by media or IL-2 for 30 minutes and then evaluated for cytotoxic activity against 51Cr-labeled (C) 721.221 or (D) K562 target cells in a 4-hour 51Cr-release assay, respectively. Cells were control siRNA (Csi, circles), WAVE2 siRNA (W2si, squares), control siRNA and wiskostatin (Csi+Wisk, downward triangles), or WAVE2 siRNA and wiskostatin (W2si+Wisk, upward triangles) treated prior to addition of media (solid black line) or IL-2 (dashed gray line) for 30 minutes. Each column of graphs depicts the effect of IL-2 (dashed line) in each condition. (E and F) F-actin content via phalloidin MFI in cells treated as per B and D, respectively, using flow cytometry (expressed as percentage change in MFI relative to unstimulated cells). Values represent means of 3 independent experiments and error bars show SD. Comparison of means is noted as not significantly or significantly (*P < 0.05) different. (G) Phosphorylated and total STAT5 in YTS cells treated as per part B via Western blot analysis. Membranes were first probed for pSTAT5 and then stripped and reprobed for total STAT5. Numbers beneath each lane represent densitometric ratios of pSTAT5 normalized to total STAT5.

References

    1. Nolz JC, et al. The WAVE2 complex regulates actin cytoskeletal reorganization and CRAC-mediated calcium entry during T cell activation. Curr Biol. 2006;16(1):24–34. doi: 10.1016/j.cub.2005.11.036. - DOI - PMC - PubMed
    1. Nolz JC, et al. The WAVE2 complex regulates T cell receptor signaling to integrins via Abl- and CrkL-C3G-mediated activation of Rap1. J Cell Biol. 2008;182(6):1231–1244. doi: 10.1083/jcb.200801121. - DOI - PMC - PubMed
    1. Zhang J, et al. Antigen receptor-induced activation and cytoskeletal rearrangement are impaired in Wiskott-Aldrich syndrome protein-deficient lymphocytes. J Exp Med. 1999;190(9):1329–1342. doi: 10.1084/jem.190.9.1329. - DOI - PMC - PubMed
    1. Cannon JL, Burkhardt JK. Differential roles for Wiskott-Aldrich syndrome protein in immune synapse formation and IL-2 production. J Immunol. 2004;173(3):1658–1662. - PubMed
    1. Kenney D, Cairns L, Remold-O’Donnell E, Peterson J, Rosen FS, Parkman R. Morphological abnormalities in the lymphocytes of patients with the Wiskott-Aldrich syndrome. Blood. 1986;68(6):1329–1332. - PubMed

Publication types

MeSH terms