. 2011 Jul 14;30(28):3153-62.
doi: 10.1038/onc.2011.44. Epub 2011 Mar 7.

Progression of BRAF-induced thyroid cancer is associated with epithelial-mesenchymal transition requiring concomitant MAP kinase and TGFβ signaling

Affiliations

Progression of BRAF-induced thyroid cancer is associated with epithelial-mesenchymal transition requiring concomitant MAP kinase and TGFβ signaling

J A Knauf et al. Oncogene. .

Abstract

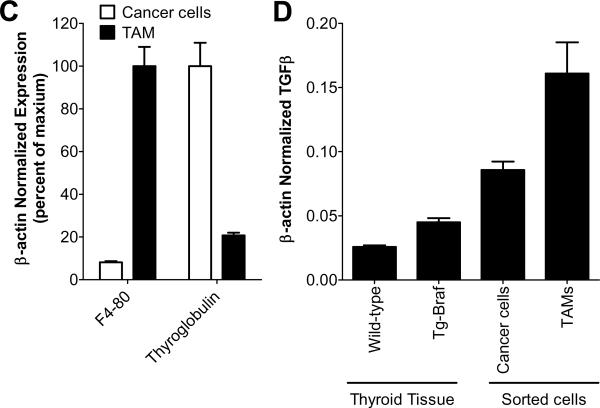
Mice with thyroid-specific expression of oncogenic BRAF (Tg-Braf) develop papillary thyroid cancers (PTCs) that are locally invasive and have well-defined foci of poorly differentiated thyroid carcinoma (PDTC). To investigate the PTC-PDTC progression, we performed a microarray analysis using RNA from paired samples of PDTC and PTC collected from the same animals by laser capture microdissection. Analysis of eight paired samples revealed a profound deregulation of genes involved in cell adhesion and intracellular junctions, with changes consistent with an epithelial-mesenchymal transition (EMT). This was confirmed by immunohistochemistry, as vimentin expression was increased and E-cadherin lost in PDTC compared with adjacent PTC. Moreover, PDTC stained positively for phospho-Smad2, suggesting a role for transforming growth factor (TGF)β in mediating this process. Accordingly, TGFβ-induced EMT in primary cultures of thyroid cells from Tg-Braf mice, whereas wild-type thyroid cells retained their epithelial features. TGFβ-induced Smad2 phosphorylation, transcriptional activity and induction of EMT required mitogen-activated protein kinase (MAPK) pathway activation in Tg-Braf thyrocytes. Hence, tumor initiation by oncogenic BRAF renders thyroid cells susceptible to TGFβ-induced EMT, through a MAPK-dependent process.


Figures

Figure 1
Figure 1. LCM of PDTC and PTC in Tg-Braf mice
A) (a) H&E staining of a thyroid from a Tg-Braf mouse replaced by PTC (black arrow) and containing foci of PDTC (white arrows)(100×). (b) Mitotic cell in a focus of PTDC (black arrow) (400×). B) Representative images of thyroid from Tg-Braf mice before and after laser capture of discrete regions of PTC and PDTC stained with HistoGene™ LCM Frozen Section Staining Kit (Arcturus, Mountain View, CA).
Figure 2
Figure 2. PDTC developing in Tg-Braf mice undergo EMT
A) A representative thyroid from a Tg-Braf mouse entirely replaced with PTC and harboring multiple foci of PDTC (indicated by arrows) stained with H&E (i, ii), E-cadherin (iii,iv), vimentin (v,vi) or pSmad2 (vii,viii) at 40× (i,iii,v,vii) and the PDTC at 200× (ii,iv,vi,viii). Images in panels vii and viii were acquired using the Nuance imaging system which converted the hematoxyllin blue counter stain to red, and the brown pSmad stain to blue, to allow better distinction of pSmad from the counter stain. B) A representative PTC and PDTC from a Tg-Braf mice stained for the activated macrophage marker, MAC-2 (200×). C) Bars represent β-actin normalized mRNA levels of F4-80 and thyroglobulin in TAMs and thyroid cancer cells, respectively, isolated from LSL-BrafV600E/TPO-Cre/ROSA26-EGFPf/f thyroids using cell sorting. D) Bars represent β-actin normalized mRNA levels of TGFβI in wild-type thyroid tissue, Tg-Braf PTCs, isolated TAMs or isolated Braf-expressing thyroid cancer cells.
Figure 3
Figure 3. TGFβ-induced EMT in primary cultures of Tg-Braf thyroid cells requires MAPK
A&B) Thyroid cells isolated from Tg-Braf (A) or wild-type (B) mice were plated into chamber slides coated with collagen and incubated for 48 h. Cells were then incubated in the absence or presence of TGFβ (10 ng/ml) with or without U0126 (25 μM) for 6 days, with a medium change every 2 days. Cells in the left panels of (A) and (B) were co-stained for E-cadherin (green) and cytokeratin (red). Cells in the right panel were stained for vimentin (green) and cytokeratin (red). Nuclei were stained with DAPI (blue). C) Tg-Braf thyroid primary cells were plated into CellBind plates and incubated for 48 h. Cells were then incubated in the absence or presence of TGFβ for 10 days in serum-free medium. RNA was isolated and used in quantitative RT-PCR reactions for the indicated transcripts.
Figure 4
Figure 4. TGFβ-induced transcription in Tg-Braf thyroid cells is MEK dependent
A) Tg-Braf thyroid cells were plated into primary culture in CellBind plates and incubated for 48 h. Cells were then incubated in the absence or presence of U0126 (25 μM) for 3 h. TGFβ (10 ng/ml) was then added for 1h. Protein lysates were prepared and subjected to Western blotting for the indicated proteins. B) Immortalized mBraf-p53 cells were incubated in the absence or presence of U0126 (25 μM) for 1–3 h. TGFβ (10 ng/ml) was then added for 1h. Protein lysates were prepared and subjected to Western blotting for the indicated proteins. C) Tg-Braf or wild-type thyroid cells were plated into primary culture in CellBind plates and incubated for 48 h. Cells were then incubated in the absence or presence of TGFβ (10 ng/ml) with or without U0126 (25 μM) for 24 h. Protein lysates were prepared and subjected to Western blotting for the indicated proteins. D&E) Primary thyroid cells from wild-type (D) or Tg-Braf (E) mice were plated into 24-well plates coated with collagen and incubated for 48 h. Cells were then co-transfected with 3TP-lux and CMV-renilla lucerifase. Sixteen hours after transfection the medium was changed to medium with or without TGFβ (10 ng/ml) and U0126 (25 μM) and incubated for 36 h. Firefly and renilla lucerifase activity were then determined. Bars represent fold-change from untreated cells in firefly lucerifase activity after normalizing for differences in renilla lucerifase activity, and subtracting background activity as determined in cells transfected with pGL3-basic.
Figure 5
Figure 5. Loss of E-cadherin staining in human anaplastic thyroid cancers
Representative E-cadherin staining of a human anaplastic thyroid cancer (ATC) with an adjacent region of PTC. PTC cells show strong membrane E-cadherin staining, which is entirely lost in the surrounding ATC cells. Open arrow indicate ATC and solid arrow indicates an area of PTC. Left: 100×, Right: 400×.

References

    1. Ball DW, Jin N, Rosen DM, Dackiw A, Sidransky D, Xing M, et al. J Clin Endocrinol Metab. 2007;92:4712–4718. - PubMed
    1. Benjamini Y, Hochberg Y. Journal of the Royal Statistical Society B. 1995;57:289–300.
    1. Bravo SB, Pampin S, Cameselle-Teijeiro J, Carneiro C, Dominguez F, Barreiro F, et al. Oncogene. 2003;22:7819–7830. - PubMed
    1. Dai M, Wang P, Boyd AD, Kostov G, Athey B, Jones EG, et al. Nucleic Acids Res. 2005;33:e175. - PMC - PubMed
    1. Depoortere F, Pirson I, Bartek J, Dumont JE, Roger PP. Mol Biol Cell. 2000;11:1061–1076. - PMC - PubMed

Publication types

MeSH terms

Substances