Clinical Trial
. 2011 Jun;53(6):1801-8.
doi: 10.1002/hep.24272. Epub 2011 May 2.

Second-phase hepatitis C virus RNA decline during telaprevir-based therapy increases with drug effectiveness: implications for treatment duration

Affiliations
Clinical Trial

Second-phase hepatitis C virus RNA decline during telaprevir-based therapy increases with drug effectiveness: implications for treatment duration

Jeremie Guedj et al. Hepatology. 2011 Jun.

Abstract

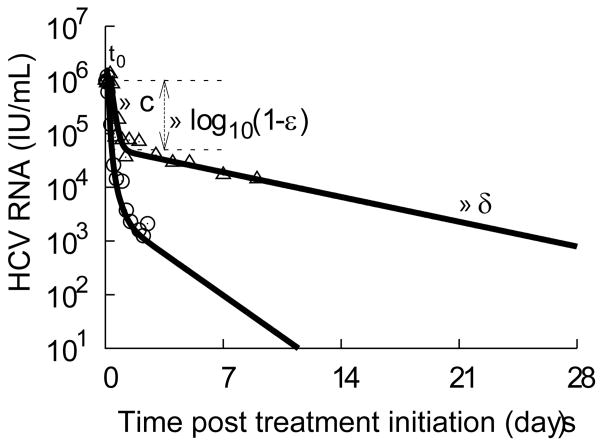
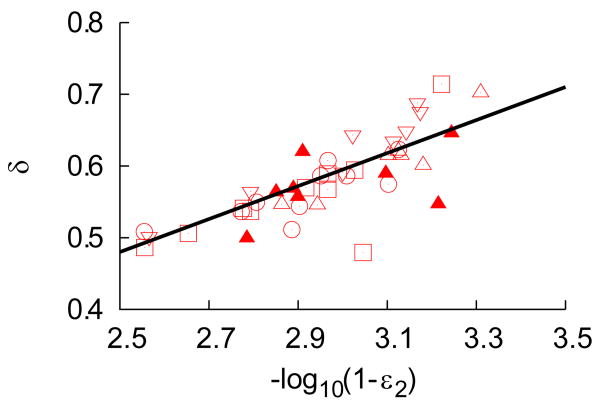
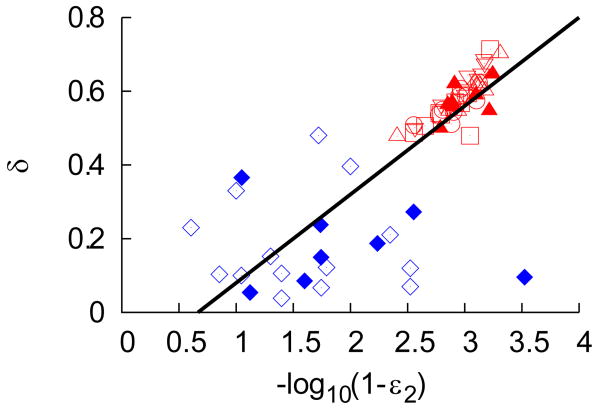
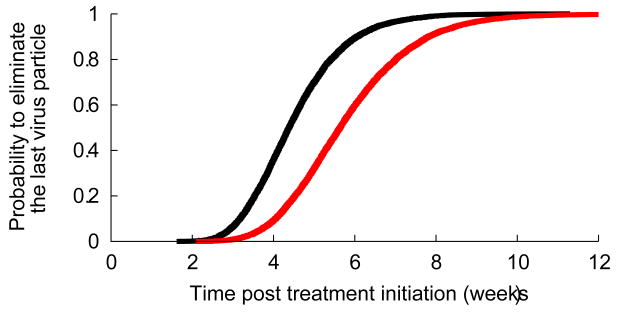
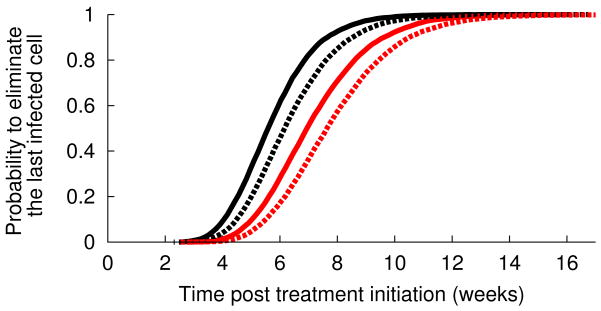
Hepatitis C virus (HCV) RNA decay during antiviral therapy is characterized by a rapid first phase, followed by a slower second phase. The current understanding of viral kinetics attributes the magnitude of the first phase of decay to treatment effectiveness, whereas the second phase of decay is attributed to the progressive loss of infected cells. Here, we analyzed data from 44 patients treated with telaprevir, a potent HCV protease inhibitor. Using a viral kinetic model that accounts for the pharmacokinetics of telaprevir, we found the second-phase slope of viral decline to be strongly correlated with treatment effectiveness and to be roughly four-fold more rapid than has been reported with interferon-based therapies. Because telaprevir is not known to increase the death rate of infected cells, our results suggest that the second-phase slope of viral decline is driven not only by the death of infected cells, but may also involve other mechanisms, such as a treatment-effectiveness-dependent degradation of intracellular viral RNA. As a result of the enhanced viral decay caused by the high antiviral effectiveness of telaprevir, we predict that if drug resistance could be avoided by using an appropriate combination of antiviral agents, treatment duration needed to clear HCV might be dramatically shortened. Indeed, we predict that in 95% of fully compliant patients, the last virus particle should be eliminated by week 7 of therapy. If the remaining infected hepatocytes act as a potential reservoir for the renewal of infection, no more than 10 weeks of treatment should be sufficient to clear the infection in 95% of fully compliant patients. However, if patients miss doses, treatment duration would need to be extended.


Figures

Figure 1
Figure 1
Typical biphasic HCV RNA decay with daily standard IFN-α (triangles represent data from subject 2D in (ref 2)). After treatment initiation at time t=0, viral load remains equal to its baseline value V0 for a short time t0. After that a rapid dose-dependent viral decline lasting for 1-2 days (first phase) followed by a slower but sustained decline (second phase) is typically observed. According to theory (2), the first phase of decline is due to the treatment effectiveness in blocking viral production, ε, and results in a decline of viral load at a rate close to the virion loss rate, c, with the magnitude viral decline depending on ε. With lower amounts of virus, less de novo infection occurs and the infected cells are not efficiently replaced, generating a second phase of viral decline at a rate determined mainly by the loss rate of infected cells, δ. By fitting this model to the data (black line), the parameters can be estimated (2) (t0=7 h, c=5.6 d-1, ε=0.95, δ=0.16 d-1). For comparison, the decline kinetics with telaprevir for a typical subject (circles represent data from subject 1 in the current study) and its best fit using the VE model (t0=2.4 h, c=12.2 d-1, ε1=0.9688, ε2=0.9978, δ=0.51 d-1) is also displayed.
Figure 2
Figure 2. The loss rate of infected cells increases with drug effectivenees
(a). Distribution of the loss rate of infected cells, δ, as a function of the final (log-transformed) effectiveness ε2 in patients dosed with telaprevir. Squares are telaprevir monotherapy 450 mg q8h, upper triangles are 750 mg q8h tablets (filled triangles when used in combination with peg-IFN), reverse triangles are 750 mg q8h suspension and circles are 1250 mg q12h suspension. The black line is the best-fit regression line (r=0.79, p-value<0.001). (b). Distribution of the loss rate of infected cells, δ, as a function of the final (log-transformed) effectiveness ε2 in patients dosed with telaprevir (red symbols) compared to values found in the literature for genotype 1 Caucasian patients treated with 10 MIU of IFN daily (2-3, 18) monotherapy (blue diamond) or in combination with ribavirin (blue filled diamond). The black line is the best-fit regression line (r=0.78, p-value<0.001) where one point, considered as an outlier, has not been taken into account.
Figure 3
Figure 3
Estimated cumulative probability distribution function (cdf) for the treatment duration needed to eliminate the last remaining (a) virus particle and (b) infected cell. The black line corresponds to perfect treatment adherence whereas the red line represents the case of partial adherence where of three doses per day one dose is randomly missed every two days (Methods). Because the cdf for the time to eliminate the last infected cell depends on the unknown value for the viral production rate in absence of treatment (p in Eq. 1), the solid lines in (b) correspond to p=100 virions/day and the dashed lines correspond to p=10 virions/day.
Figure 3
Figure 3
Estimated cumulative probability distribution function (cdf) for the treatment duration needed to eliminate the last remaining (a) virus particle and (b) infected cell. The black line corresponds to perfect treatment adherence whereas the red line represents the case of partial adherence where of three doses per day one dose is randomly missed every two days (Methods). Because the cdf for the time to eliminate the last infected cell depends on the unknown value for the viral production rate in absence of treatment (p in Eq. 1), the solid lines in (b) correspond to p=100 virions/day and the dashed lines correspond to p=10 virions/day.

Similar articles

Cited by

References

    1. Hepatitis C fact sheet. [Accessed July 13, 2009]; Available from: http://www.who.int/mediacentre/factsheets/fs164/en/
    1. Neumann AU, Lam NP, Dahari H, Gretch DR, Wiley TE, Layden TJ, Perelson AS. Hepatitis C viral dynamics in vivo and the antiviral efficacy of interferon-alpha therapy. Science. 1998;282:103–107. - PubMed
    1. Dixit NM, Layden-Almer JE, Layden TJ, Perelson AS. Modelling how ribavirin improves interferon response rates in hepatitis C virus infection. Nature. 2004;432:922–924. - PubMed
    1. Guedj J, Rong L, Dahari H, Perelson AS. A perspective on modelling hepatitis C virus infection. J Viral Hepat. 2010;17:825–833. - PMC - PubMed
    1. Pilli M, Zerbini A, Penna A, Orlandini A, Lukasiewicz E, Pawlotsky J, Zeuzem S, et al. HCV-specific T-cell response in relation to viral kinetics and treatment outcome (DITTO-HCV project) Gastroenterology. 2007;133:1132–1143. - PubMed

Publication types

MeSH terms