. 2011 Mar 7;134(9):095104.
doi: 10.1063/1.3556671.

Power-law dependence of the melting temperature of ubiquitin on the volume fraction of macromolecular crowders

Affiliations

Power-law dependence of the melting temperature of ubiquitin on the volume fraction of macromolecular crowders

Matthias M Waegele et al. J Chem Phys. .

Abstract

The dependence of the melting temperature increase (ΔT(m)) of the protein ubiquitin on the volume fraction (ϕ) of several commonly used macromolecular crowding agents (dextran 6, 40, and 70 and ficoll 70) was quantitatively examined and compared to a recently developed theoretical crowding model, i.e., ΔT(m) ∼ (R(g)∕R(c))(α)φ(α∕3). We found that in the current case this model correctly predicts the power-law dependence of ΔT(m) on φ but significantly overestimates the role of the size (i.e., R(c)) of the crowding agent. In addition, we found that for ubiquitin the exponent α is in the range of 4.1-6.5, suggesting that the relation of α=3∕(3ν-1) is a better choice for estimating α based on the Flory coefficient (ν) of the polypeptide chain. Taken together these findings highlight the importance of improving our knowledge and theoretical treatment of the microcompartmentalization of the commonly used model crowding agents.


Figures

Figure 1
Figure 1
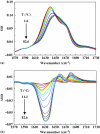
Temperature dependent FTIR spectra (a) and difference FTIR spectra (b) of ubiquitin at pH* 1 in D2O. The lowest and highest temperatures in this case were 1.6 and 82.6 °C, respectively.
Figure 2
Figure 2
Thermal melting curves constructed from the normalized second-component coefficients obtained by singular value decomposition analysis of the temperature dependent FTIR spectra of ubiquitin under different solution conditions, as indicated. The data points below 30 °C are not shown for clarity. Lines are fits of these data to Eq. 2 and the resultant fitting parameters are listed in Table 1.
Figure 3
Figure 3
Thermal melting temperature (Tm) of ubiquitin as a function of the volume fraction (φ) of different crowding agents, as indicted. Lines are fits of these data to Eq. 1, i.e., Tmϕ=Tmd+Cϕα3, and the resultant fitting parameters are listed in Table 2. The standard deviations of the data points were assumed to be the same as those for the melting temperature in dilute solution (see Table 1).

Similar articles

Cited by

References

    1. Zhou H.-X., Rivas G., and Minton A. P., Annu. Rev. Biophys. 37, 375 (2008).10.1146/annurev.biophys.37.032807.125817 - DOI - PMC - PubMed
    1. Dix J. A. and Verkman A. S., Annu. Rev. Biophys. 37, 247 (2008).10.1146/annurev.biophys.37.032807.125824 - DOI - PubMed
    1. Richter K., Nessling M., and Lichter P., Biochim. Biophys. Acta 1738, 2100 (2008).10.1016/j.bbamcr.2008.07.017 - DOI - PubMed
    1. van den Berg B., Wain R., Dobson C. M., and Ellis R. J., EMBO J. 18, 6927 (2000).10.1093/emboj/18.24.6927 - DOI - PMC - PubMed
    1. Qu Y. X. and Bolen D. W., Biophys. Chem. 101, 155 (2002).10.1016/S0301-4622(02)00148-5 - DOI - PubMed

Publication types

MeSH terms