Comparative Study
. 2011 Mar 8:12:68.
doi: 10.1186/1471-2105-12-68.

Comparing genotyping algorithms for Illumina's Infinium whole-genome SNP BeadChips

Collaborators, Affiliations
Comparative Study

Comparing genotyping algorithms for Illumina's Infinium whole-genome SNP BeadChips

Matthew E Ritchie et al. BMC Bioinformatics. .

Abstract

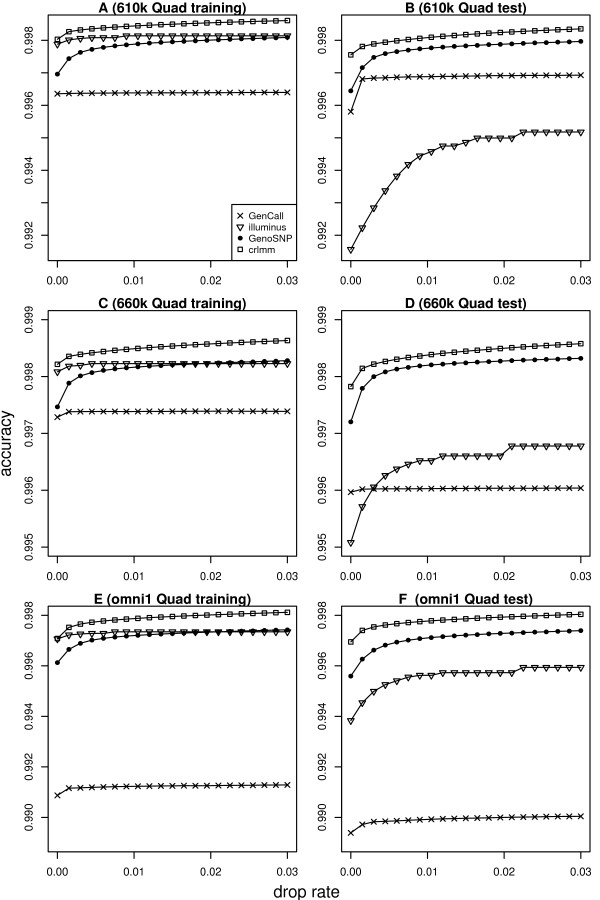
Background: Illumina's Infinium SNP BeadChips are extensively used in both small and large-scale genetic studies. A fundamental step in any analysis is the processing of raw allele A and allele B intensities from each SNP into genotype calls (AA, AB, BB). Various algorithms which make use of different statistical models are available for this task. We compare four methods (GenCall, Illuminus, GenoSNP and CRLMM) on data where the true genotypes are known in advance and data from a recently published genome-wide association study.

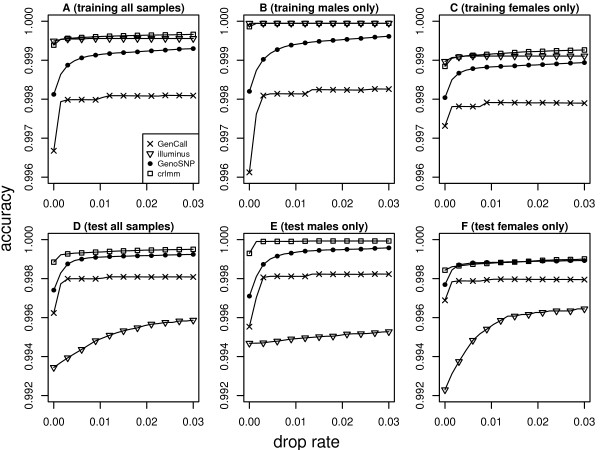
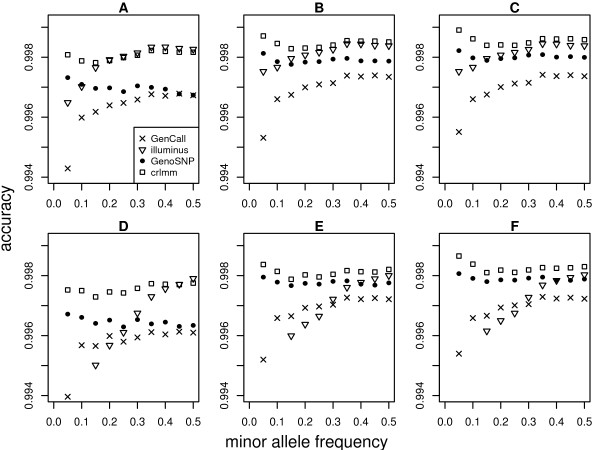
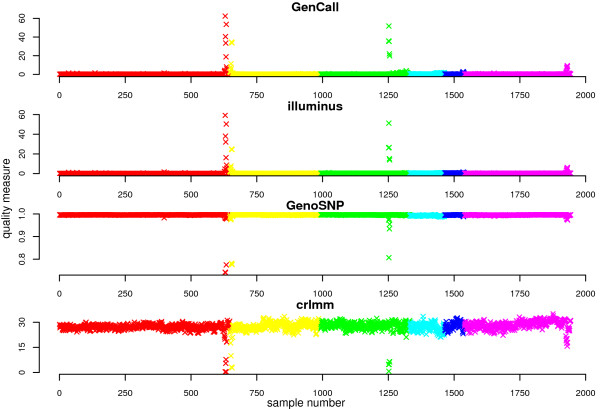
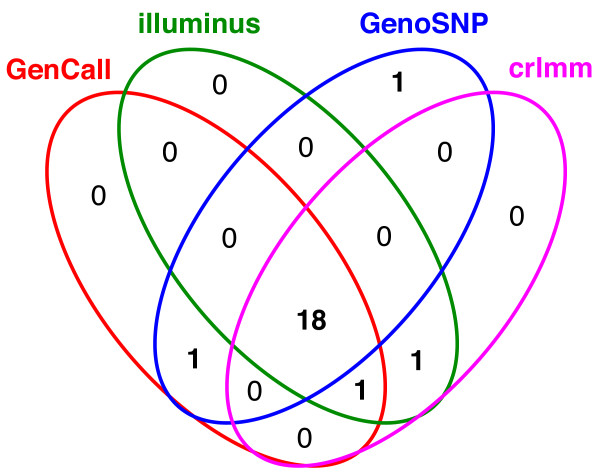
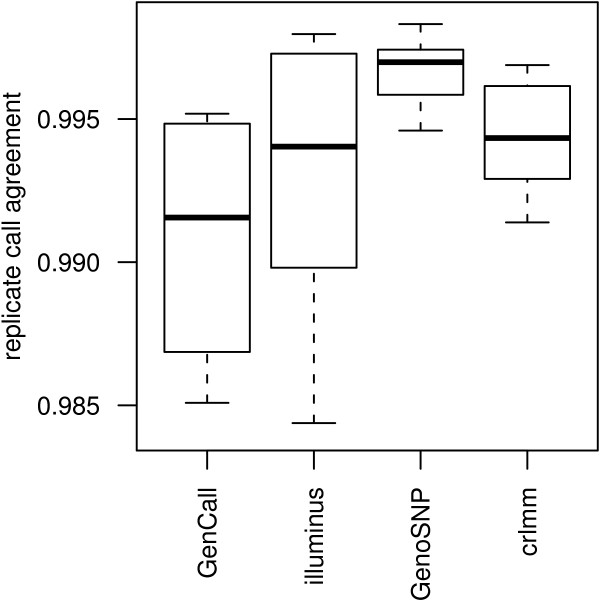
Results: In general, differences in accuracy are relatively small between the methods evaluated, although CRLMM and GenoSNP were found to consistently outperform GenCall. The performance of Illuminus is heavily dependent on sample size, with lower no call rates and improved accuracy as the number of samples available increases. For X chromosome SNPs, methods with sex-dependent models (Illuminus, CRLMM) perform better than methods which ignore gender information (GenCall, GenoSNP). We observe that CRLMM and GenoSNP are more accurate at calling SNPs with low minor allele frequency than GenCall or Illuminus. The sample quality metrics from each of the four methods were found to have a high level of agreement at flagging samples with unusual signal characteristics.

Conclusions: CRLMM, GenoSNP and GenCall can be applied with confidence in studies of any size, as their performance was shown to be invariant to the number of samples available. Illuminus on the other hand requires a larger number of samples to achieve comparable levels of accuracy and its use in smaller studies (50 or fewer individuals) is not recommended.


Figures

Figure 1
Figure 1
Accuracy versus drop rate plots for the four methods tested. Figures on the left-hand side show results for the training data sets from 610 k Quad (A), 660 k Quad (C) and omni1 Quad (E) BeadChips. Figures on the right-hand side show results for the test data sets from the 610 k Quad (B), 660 k Quad (D) and omni1 Quad (F) BeadChips. Results are shown for autosomal SNPs only. CRLMM gives slightly more correct calls than the other methods for these high density chip types. GenCall is almost always slightly worse than the other methods. GenoSNP performs very consistently between data sets, achieving accuracy slightly below CRLMM. The accuracy of Illuminus seems to improve as the number of samples available increases (accuracy starts off at around 0.992 in B with 27 samples, and increases to 0.995 in D with 47 samples and 0.998 in A and C where in excess of 200 samples are available).
Figure 2
Figure 2
The effect of sample size on results from Illuminus. Illuminus average no call rate for 660 k Quad training data for varying numbers of samples (A). The average proportion of calls assigned to the 'no call' class by the model per sample declines as the number of samples included in the analysis increases. Accuracy versus drop rate from 6 different Illuminus analyses in panel A involving varying numbers of samples are also shown (B). As the number of samples analyzed increases, the accuracy measured in terms of agreement with the independent HapMap calls improves. Note that SNPs assigned to the 'no call' class are excluded from these calculations.
Figure 3
Figure 3
Accuracy versus drop rate plots for the four methods tested for X chromosome SNPs. Results are shown for all samples (A), males only (B) or females only (C) from the 610 k Quad training data and all samples (D), males only (E) or females only (F) from the 610 k Quad test data respectively. Methods with separate models for male and female samples (Illuminus and CRLMM) are generally more accurate than methods which use the same model for both sexes (GenCall, GenoSNP). Performance of Illuminus in the test data set is worse than the other three methods despite the sex-specific model. Again this is due to small sample size. In the training data set there were 121 males and 104 females, and in the test data set there were 13 males and 14 females.
Figure 4
Figure 4
Accuracy by minor allele frequency. Accuracy for the 610 k Quad training data after 0% (A), 1% (B) and 2% (C) of calls with lowest confidence were removed from the analysis. The x-axis in each plot shows MAF calculated from 0.05 (5%) to 0.5 (50%) in increments of 0.05 (5%). Similar plots are shown for the 610 k Quad test data, with figures D, E and F displaying accuracy after 0%, 1% and 2% of the calls with lowest confidence were dropped from the analysis. Ignoring the overall differences in accuracy, which are consistent with the results seen in Figure 1, we see that different methods vary in performance by MAF. For example, the accuracy profile of GenCall and Illuminus increases fairly monotonically as the frequency of the rarer allele increases, with lowest accuracy obtained for SNPs with a MAF of 5% or lower. GenoSNP and CRLMM are most accurate at calling rarer alleles, and have a more consistent accuracy profile as MAF varies. These trends are consistent as more SNPs are excluded from the analysis. As we have seen in other analyses, the more samples available, the better the performance of Illuminus with higher accuracy achieved on the training data (225 samples) compared to the test data (27 samples). In figures D, E and F, the accuracies at minor allele frequencies of 5% and 10% are not plotted for Illuminus as they fall are below 0.994 (0.928 and 0.987 respectively at 0% drop rate, 0.961 and 0.992 at 1% and 0.966 and 0.993 at 2%). For Illuminus and GenoSNP, SNPs assigned to the 'no call' class are excluded from the accuracy calculations. These figures show results for autosomal SNPs only.
Figure 5
Figure 5
Smoothed scatter plots of log-ratios versus average intensities for a sample run in replicate. This figure gives an example of signal from a good quality array (A), with three well-separated clusters of points which approximately correspond to the AA (top cluster), AB (middle cluster) and BB (bottom cluster) genotypes. Signal from the same sample which is clearly of very low quality is also shown (B). In this plot we see one cluster of points, rather than the expected three. This major cluster occurs at low intensity (≈6), which is also highly unusual (intensities between 8 and 14 on the log2-scale are typical). In each panel, non-normalized log-ratios (M) are plotted on the y-axis versus average intensities (S) on the x-axis.
Figure 6
Figure 6
Measures of sample quality for the MS-GWAS by genotyping method. Samples from different batches (from 1 to 6) are plotted in different colors. For GenCall and Illuminus, the per sample no call rate (%) is used to measure sample quality. The GenoSNP per sample quality measure is the average posterior probability of all calls within a sample, with higher values (closer to 1) indicative of higher quality. In CRLMM a signal-to-noise score which measures separation between the 3 major clusters in each sample (Figure 5A) is calculated. For this measure, higher scores represent higher quality. Despite the differences in scale, all methods appear to assign the most extreme quality scores (highest values in the case of GenCall and Illuminus, and lowest for GenoSNP and CRLMM) to the same samples.
Figure 7
Figure 7
Agreement between methods for the 20 lowest quality samples ranked by each algorithm. All methods agree on 18 samples, GenCall, Illuminus and CRLMM all agree on a further sample. CRLMM and Illuminus or GenoSNP and GenCall both agree on another sample each. The sample flagged by GenoSNP alone was ranked just outside the worst 20 samples by the other methods (22nd, 23rd and 25th for GenCall, Illuminus and CRLMM respectively). Plots of the raw signal from 3 samples ranked amongst the worst 20 by all methods are given in Additional File 1: Supplemental Figure S5.
Figure 8
Figure 8
Concordance between genotype calls from replicate samples by method. Boxplots of the replicate concordance for 10 samples from the MS-GWAS which were analyzed using DNA derived from both saliva and blood. High concordance between replicates calls (> 98.5% agreement) is the norm. The 8th sample is an exception, due to poor quality of one of the replicates (Figure 5). For this pair of samples, the concordance values are 16.6%, 15.6% and 40.8% for GenCall, Illuminus and CRLMM respectively (values not plotted as they are off the scale). GenoSNP did not produce calls for one of the samples (Figure 5B), so concordance could not be calculated for this replicate pair.

References

    1. Yu W, Gwinn M, Clyne M, Yesupriya A, Khoury MJ. A navigator for human genome epidemiology. Nat Genet. 2008;40:124–5. doi: 10.1038/ng0208-124. - DOI - PubMed
    1. International HapMap Consortium. A second generation human haplotype map of over 3.1 million SNPs. Nature. 2007;449:851–61. doi: 10.1038/nature06258. - DOI - PMC - PubMed
    1. Steemers F, Chang W, Lee G, Barker D, Shen R, Gunderson K. Whole-genome genotyping with the single-base extension assay. Nat Methods. 2006;3:31–3. doi: 10.1038/nmeth842. - DOI - PubMed
    1. Peiffer D, Le J, Steemers F, Chang W, Jenniges T, Garcia F, Haden K, Li J, Shaw C, Belmont J, Cheung S, Shen R, Barker D, Gunderson K. High-resolution genomic profiling of chromosomal aberrations using Infinium whole-genome genotyping. Genome Res. 2006;16:1136–48. doi: 10.1101/gr.5402306. - DOI - PMC - PubMed
    1. Kermani BG. Artificial intelligence and global normalization methods for genotyping. 2008. http://www.patentstorm.us/patents/7467117/fulltext.html

Publication types

LinkOut - more resources