

Improved recovery of the hemodynamic response in diffuse optical imaging using short optode separations and state-space modeling
- PMID: 21385616
- PMCID: PMC3085546
- DOI: 10.1016/j.neuroimage.2011.03.001
Improved recovery of the hemodynamic response in diffuse optical imaging using short optode separations and state-space modeling
Abstract
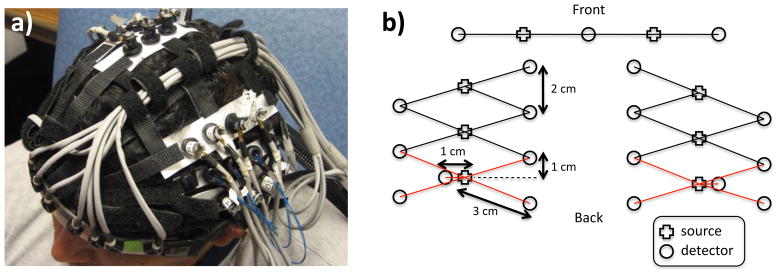
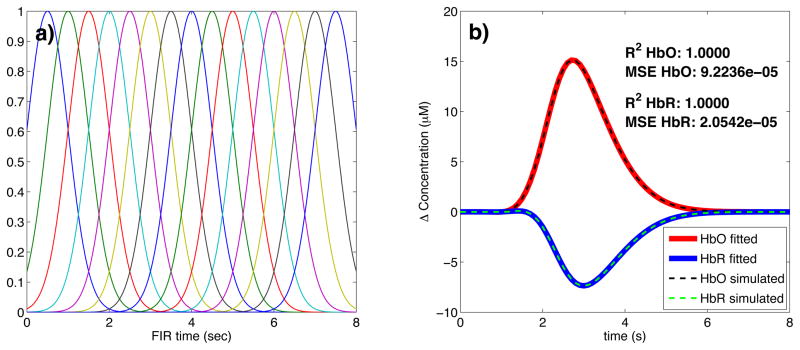
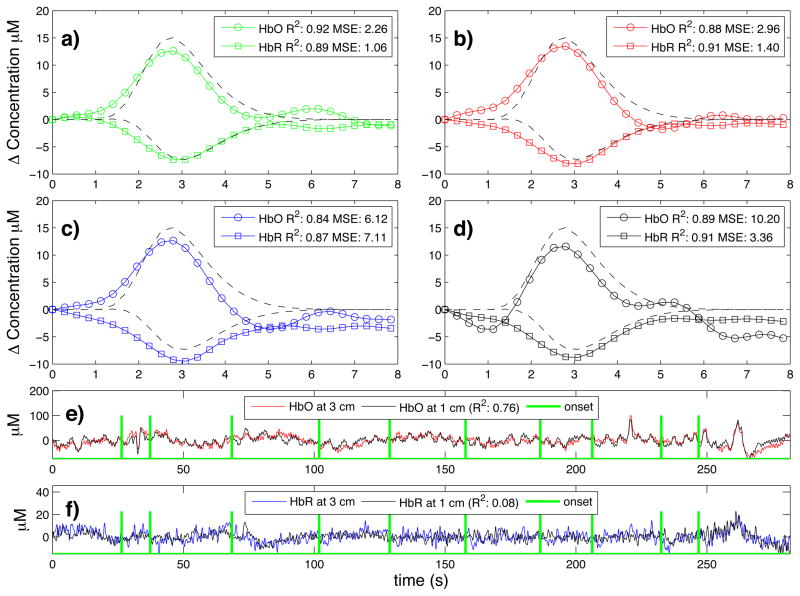
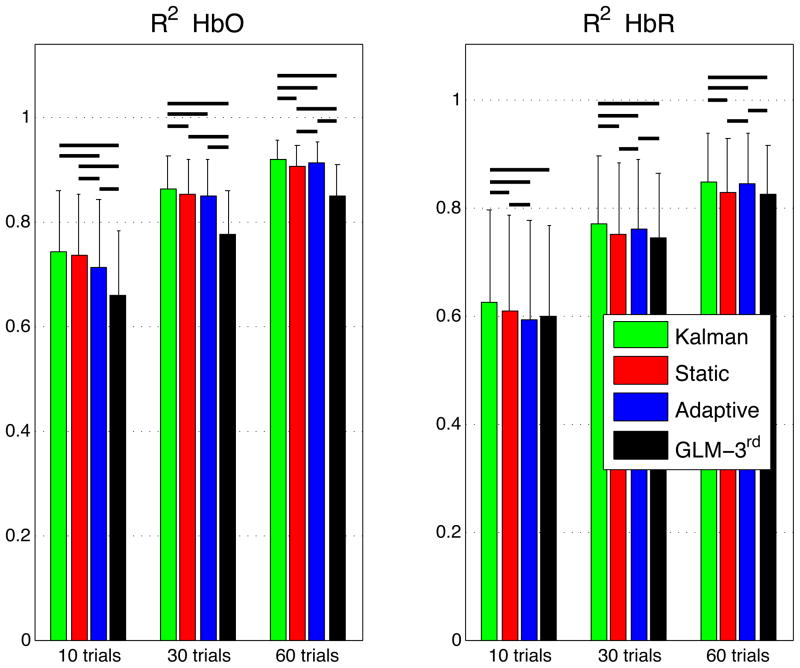
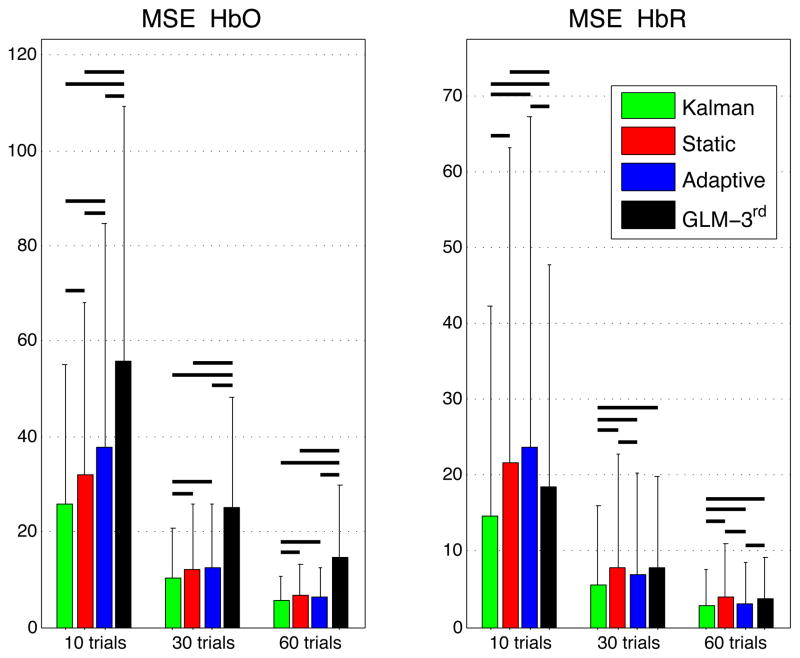
Diffuse optical imaging (DOI) allows the recovery of the hemodynamic response associated with evoked brain activity. The signal is contaminated with systemic physiological interference which occurs in the superficial layers of the head as well as in the brain tissue. The back-reflection geometry of the measurement makes the DOI signal strongly contaminated by systemic interference occurring in the superficial layers. A recent development has been the use of signals from small source-detector separation (1cm) optodes as regressors. Since those additional measurements are mainly sensitive to superficial layers in adult humans, they help in removing the systemic interference present in longer separation measurements (3 cm). Encouraged by those findings, we developed a dynamic estimation procedure to remove global interference using small optode separations and to estimate simultaneously the hemodynamic response. The algorithm was tested by recovering a simulated synthetic hemodynamic response added over baseline DOI data acquired from 6 human subjects at rest. The performance of the algorithm was quantified by the Pearson R(2) coefficient and the mean square error (MSE) between the recovered and the simulated hemodynamic responses. Our dynamic estimator was also compared with a static estimator and the traditional adaptive filtering method. We observed a significant improvement (two-tailed paired t-test, p<0.05) in both HbO and HbR recovery using our Kalman filter dynamic estimator compared to the traditional adaptive filter, the static estimator and the standard GLM technique.
Copyright © 2011 Elsevier Inc. All rights reserved.
Figures
Similar articles
-
Short separation channel location impacts the performance of short channel regression in NIRS.Neuroimage. 2012 Feb 1;59(3):2518-28. doi: 10.1016/j.neuroimage.2011.08.095. Epub 2011 Sep 8. Neuroimage. 2012. PMID: 21945793 Free PMC article.
-
Further improvement in reducing superficial contamination in NIRS using double short separation measurements.Neuroimage. 2014 Jan 15;85 Pt 1(0 1):127-35. doi: 10.1016/j.neuroimage.2013.01.073. Epub 2013 Feb 9. Neuroimage. 2014. PMID: 23403181 Free PMC article.
-
Analysis of task-evoked systemic interference in fNIRS measurements: insights from fMRI.Neuroimage. 2014 Feb 15;87:490-504. doi: 10.1016/j.neuroimage.2013.10.024. Epub 2013 Oct 19. Neuroimage. 2014. PMID: 24148922
-
Diffuse optical imaging of brain activation: approaches to optimizing image sensitivity, resolution, and accuracy.Neuroimage. 2004;23 Suppl 1:S275-88. doi: 10.1016/j.neuroimage.2004.07.011. Neuroimage. 2004. PMID: 15501097 Review.
-
Measurement of brain activity by near-infrared light.J Biomed Opt. 2005 Jan-Feb;10(1):11008. doi: 10.1117/1.1854673. J Biomed Opt. 2005. PMID: 15847574 Review.
Cited by
-
Towards Neuroscience of the Everyday World (NEW) using functional Near-Infrared Spectroscopy.Curr Opin Biomed Eng. 2021 Jun;18:100272. doi: 10.1016/j.cobme.2021.100272. Epub 2021 Feb 3. Curr Opin Biomed Eng. 2021. PMID: 33709044 Free PMC article.
-
Reducing motion artifacts for long-term clinical NIRS monitoring using collodion-fixed prism-based optical fibers.Neuroimage. 2014 Jan 15;85 Pt 1(0 1):192-201. doi: 10.1016/j.neuroimage.2013.06.054. Epub 2013 Jun 22. Neuroimage. 2014. PMID: 23796546 Free PMC article.
-
Deep learning-based motion artifact removal in functional near-infrared spectroscopy.Neurophotonics. 2022 Oct;9(4):041406. doi: 10.1117/1.NPh.9.4.041406. Epub 2022 Apr 23. Neurophotonics. 2022. PMID: 35475257 Free PMC article.
-
Real-Time Non-invasive Assessment of Cerebral Hemodynamics With Diffuse Optical Spectroscopies in a Neuro Intensive Care Unit: An Observational Case Study.Front Med (Lausanne). 2020 Apr 28;7:147. doi: 10.3389/fmed.2020.00147. eCollection 2020. Front Med (Lausanne). 2020. PMID: 32411712 Free PMC article.
-
Reliability of Frontal Eye Fields Activation and Very Low-Frequency Oscillations Observed during Vergence Eye Movements: an fNIRS Study.Sci Rep. 2020 Jan 20;10(1):712. doi: 10.1038/s41598-020-57597-4. Sci Rep. 2020. PMID: 31959829 Free PMC article.
References
-
- Boas D, Dale AM, Franceschini MA. Diffuse optical imaging of brain activation: Approaches to optimizing image sensitivity, resolution and accuracy. Neuroimage. 2004;23:S275–S288. - PubMed
-
- Cope M, Deply DT. System for long-term measurement of cerebral blood flow and tissue oxygenation on newborn infants by infrared transillumination. Med Biol Eng Comput. 1998;26:289–294. - PubMed
-
- Deply DT, Cope M, van der Zee P, Arridge S, Wray S, Wyatt J. Estimation of optical pathlength through tissue from direct time of flight measurement. Phys Med Biol. 1988;33:1433–1442. - PubMed
Publication types
MeSH terms
Substances
Grants and funding
LinkOut - more resources
Full Text Sources
Other Literature Sources
Medical
