. 2011 Jun 1;56(3):1145-53.
doi: 10.1016/j.neuroimage.2011.02.082. Epub 2011 Mar 6.

White matter cerebral blood flow is inversely correlated with structural and functional connectivity in the human brain

Affiliations

White matter cerebral blood flow is inversely correlated with structural and functional connectivity in the human brain

Sina Aslan et al. Neuroimage. .

Abstract

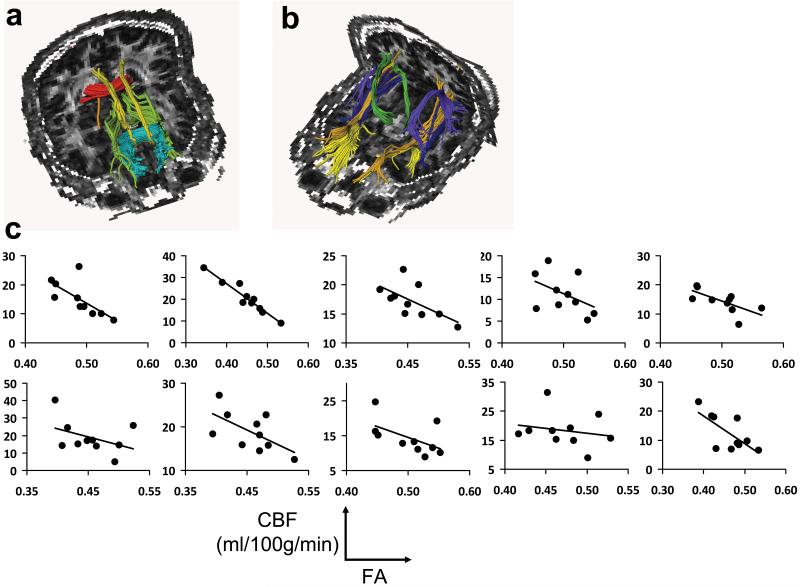
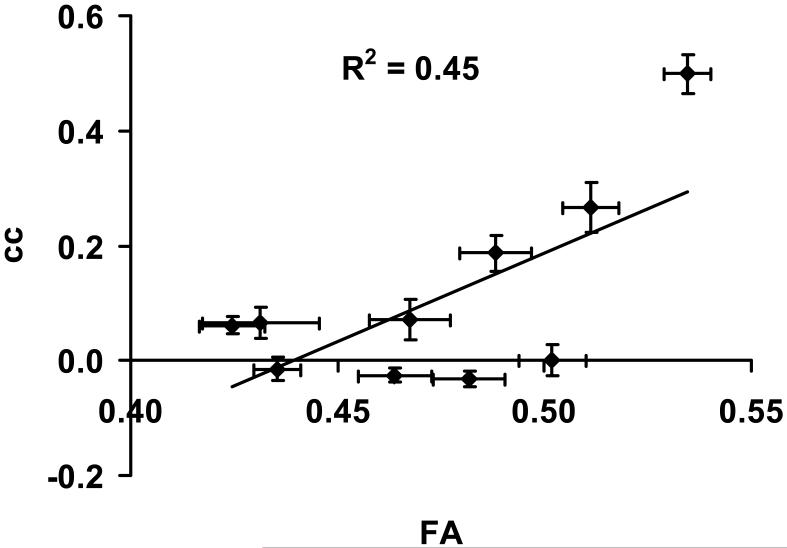
White matter provides anatomic connections among brain regions and has received increasing attention in understanding brain intrinsic networks and neurological disorders. Despite significant progresses made in characterizing the white matter's structural properties using post-mortem techniques and in vivo diffusion-tensor-imaging (DTI) methods, its physiology remains poorly understood. In the present study, cerebral blood flow (CBF) of the white matter was investigated on a fiber tract-specific basis using MRI (n=10, 25-33 years old). It was found that CBF in the white matter varied considerably, up to a factor of two between fiber groups. Furthermore, a paradoxically inverse correlation was observed between white matter CBF and structural and functional connectivities (P<0.001). Fiber tracts that had a higher CBF tended to have a lower fractional anisotropy in water diffusion, and the gray matter terminals connected to the tract also tended to have a lower temporal synchrony in resting-state BOLD signal fluctuation. These findings suggest a clear association between white matter perfusion and gray matter activity, but the nature of this relationship requires further investigations given that they are negatively, rather than positively, correlated.


Figures

Figure 1
Figure 1
Illustration of image coregistration procedures across modalities and examples of parametric maps. The T2-weighted (T2w) EPI image was used as a template to which all other images are coregistered. The T2w image was also used for segmentation of the brain into gray matter, white matter and CSF. The probability map of the white matter is shown.
Figure 2
Figure 2
Relationship between tract-specific FA and CBF. (a,b) Illustration of ten major fiber tracts overlaid on FA maps. For clarity, five fibers are shown in (a) and five are shown in (b). The fibers in (a) are: forceps major of the corpus callosum (red), forceps minor of the corpus callosum (blue), cingulum in the cingulate cortex (yellow), cingulum to hippocampus (orange), and anterior thalamic radiation (green). The fibers in (b) are: uncinate fasciculus (yellow), corticospinal tract (green), arcuate fasciculus (pink), inferior fronto-occipital fasciculus (blue), and inferior longitudinal fasciculus (orange). (c) Scatter plots between FA and CBF across fiber tracts. Each sub-plot displays data from one subject. Within a sub-plot, different points indicate different tracts. An inverse correlation is observed in all subjects. In statistical analysis, the cc values from the sub-plots are combined in a meta-analysis to yield a t statistic.
Figure 3
Figure 3
Scatter plots between CBF and radial diffusivity (a), axial diffusivity (b) and ADC (c). Each symbol represents data from one fiber tract averaged over all subjects. The error bars indicate standard error of mean. CBF was positively correlated with radial diffusivity (P=0.001), but was negatively correlated with axial diffusivity (P=0.003) and ADC (P<0.001).
Figure 4
Figure 4
Relationship between tract-specific CBF and fcMRI cc values. (a) Illustration of “cingulum-in-the-cingulated-cortex” tract and the gray matter nodes in the posterior cingulate cortex and medial frontal cortex. (b) Scatter plots between CBF and fcMRI cc across fiber tracts. Each sub-plot displays data from one subject. Within a sub-plot, different points indicate different tracts. An inverse correlation is observed in all subjects.
Figure 5
Figure 5
Scatter plot between FA and fcMRI cc values. Each symbol represents data from one fiber tract (and associated gray matter nodes) averaged over all subjects. The error bars indicate standard error of mean. FA was positively correlated with fcMRI cc (P<0.001).

References

    1. Aboitiz F, Scheibel AB, Fisher RS, Zaidel E. Fiber composition of the human corpus callosum. Brain Res. 1992;598:143–153. - PubMed
    1. Achard S, Salvador R, Whitcher B, Suckling J, Bullmore E. A resilient, low-frequency, small-world human brain functional network with highly connected association cortical hubs. J Neurosci. 2006;26:63–72. - PMC - PubMed
    1. Alexander DC, Hubbard PL, Hall MG, Moore EA, Ptito M, Parker GJ, Dyrby TB. Orientationally invariant indices of axon diameter and density from diffusion MRI. Neuroimage. 2010;52:1374–1389. - PubMed
    1. Alsop DC, Detre JA. Reduced transit-time sensitivity in noninvasive magnetic resonance imaging of human cerebral blood flow. J Cereb Blood Flow Metab. 1996;16:1236–1249. - PubMed
    1. Aslan S, Lu H. On the sensitivity of ASL MRI in detecting regional differences in cerebral blood flow. Magn Reson Imaging. 2010;28:928–935. - PMC - PubMed

Publication types

LinkOut - more resources