

Research output on primary care in Australia, Canada, Germany, the Netherlands, the United Kingdom, and the United States: bibliometric analysis
- PMID: 21385804
- PMCID: PMC3050436
- DOI: 10.1136/bmj.d1028
Research output on primary care in Australia, Canada, Germany, the Netherlands, the United Kingdom, and the United States: bibliometric analysis
Abstract
Objective: To compare the volume and quality of original research in primary care published by researchers from primary care in the United Kingdom against five countries with well established academic primary care.
Design: Bibliometric analysis.
Setting: United Kingdom, United States, Australia, Canada, Germany, and the Netherlands. Studies reviewed Research publications relevant to comprehensive primary care and authored by researchers from primary care, recorded in Medline and Embase, with publication dates 2001-7 inclusive.
Main outcome measures: Volume of published activity of generalist primary care researchers and the quality of the research output by those publishing the most using citation metrics: numbers of cited papers, proportion of cited papers, and mean citation scores.
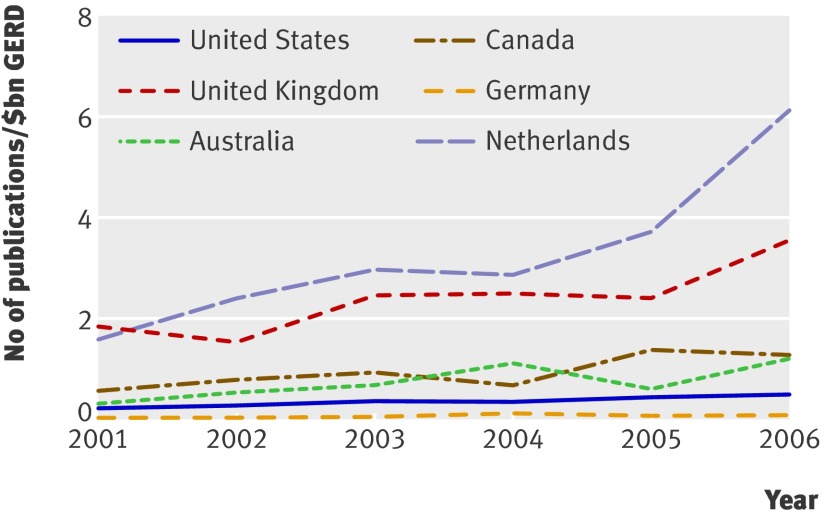
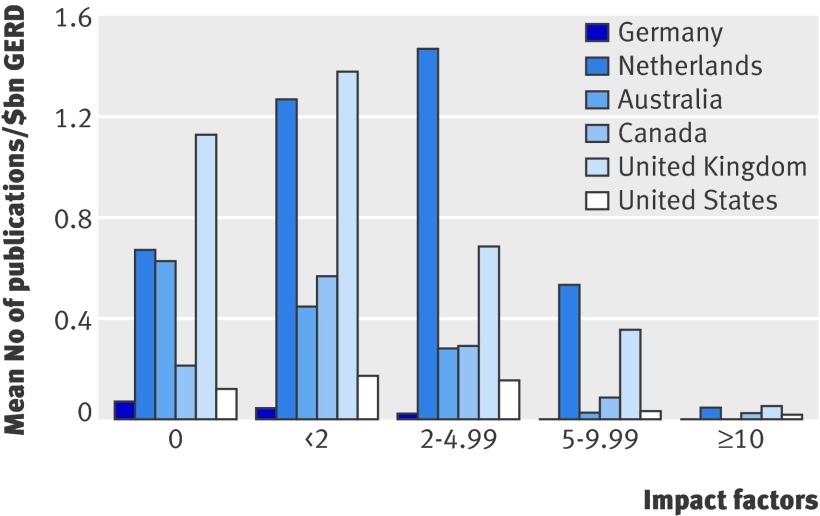
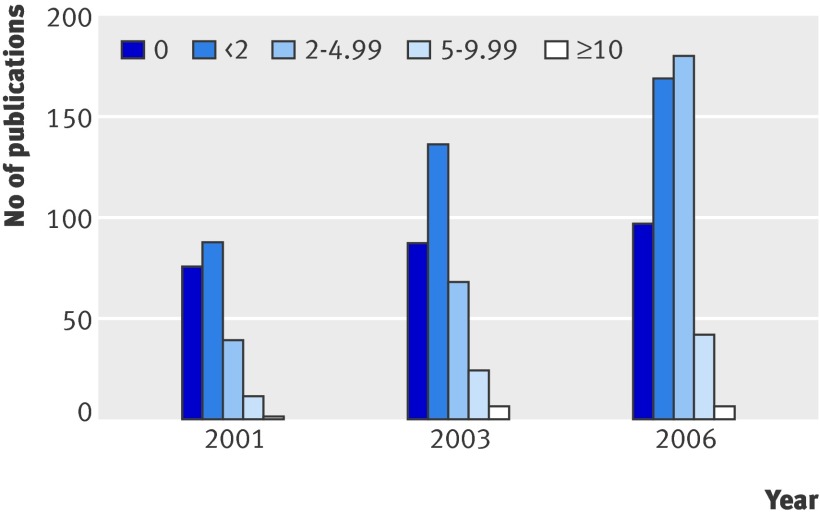
Results: 82,169 papers published between 2001 and 2007 in the six countries were classified as research on primary care. In a 15% pragmatic random sample of these records, 40% of research on primary care from the United Kingdom and 46% from the Netherlands was authored by researchers employed in a primary care setting or employed in academic departments of primary care. The 141 researchers with the highest volume of publications reporting research findings published between 2001 and 2007 (inclusive) authored or part authored 8.3% of the total sample of papers. For authors with the highest proportion of publications cited at least five times, the best performers came from the United States (n=5), United Kingdom (n=4), and the Netherlands (n=2). In the top 10 of authors with the highest proportions of publications achieving 20 or more citations, six were from the United Kingdom and four from the United States. The mean Hirsch index (measure of a researcher's productivity and impact of the published work) was 14 for the Netherlands, 13 for the United Kingdom, 12 for the United States, 7 for Canada, 4 for Australia, and 3 for Germany.
Conclusion: This international comparison of the volume and citation rates of papers by researchers from primary care consistently placed UK researchers among the best performers internationally.
Conflict of interest statement
Competing interests: All authors have completed the Unified Competing Interest form at
Figures

Comment in
-
Using bibliometrics to define the quality of primary care research.BMJ. 2011 Mar 8;342:d1083. doi: 10.1136/bmj.d1083. BMJ. 2011. PMID: 21385805 No abstract available.
References
-
- Rae 2008. Quality profiles. www.rae.ac.uk/Results/.
-
- Higher Education Funding Council for England. Data for quality-related research (QR) funding. 2010-11 QR funding. www.hefce.ac.uk/research/funding/QRFunding/.
-
- Higher Education Statistics Agency. Release of 2007/08 HESA finance data reveals income of UK higher education sector up 10% in 2007/08. www.hesa.ac.uk/index.php?option=com_content&task=view&id=1404&Itemid=161.
-
- Adams J, Cook N, Law G, Marshall S, Mount D, Smith D, et al. The role of selectivity and the characteristics of excellence. Report to the Higher Education Funding Council for England: a consultancy study within the Fundamental Review of Research Policy and Funding. Evidence; 2000.
-
- Katz J. OECD main science and technology indicators. 2000. OECD Statistics 1999 and ISI National Science Indicators. OECD.
Publication types
MeSH terms
LinkOut - more resources
Full Text Sources