. 2011 Jul;39(12):5025-35.
doi: 10.1093/nar/gkr107. Epub 2011 Mar 8.

Requirement of TFIIH kinase subunit Mat1 for RNA Pol II C-terminal domain Ser5 phosphorylation, transcription and mRNA turnover

Affiliations

Requirement of TFIIH kinase subunit Mat1 for RNA Pol II C-terminal domain Ser5 phosphorylation, transcription and mRNA turnover

Katja Helenius et al. Nucleic Acids Res. 2011 Jul.

Abstract

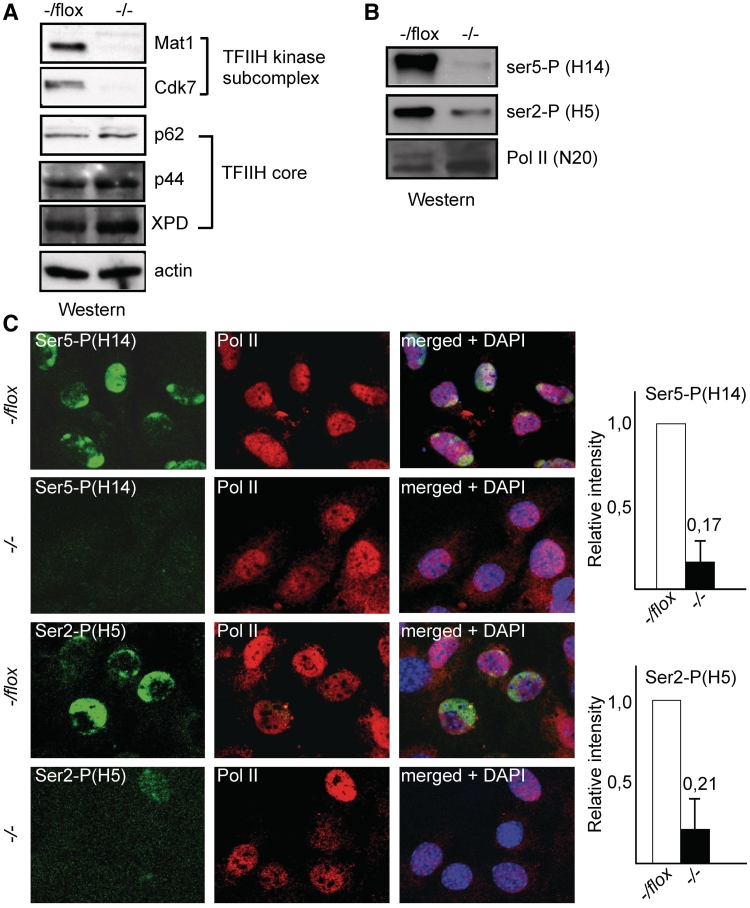
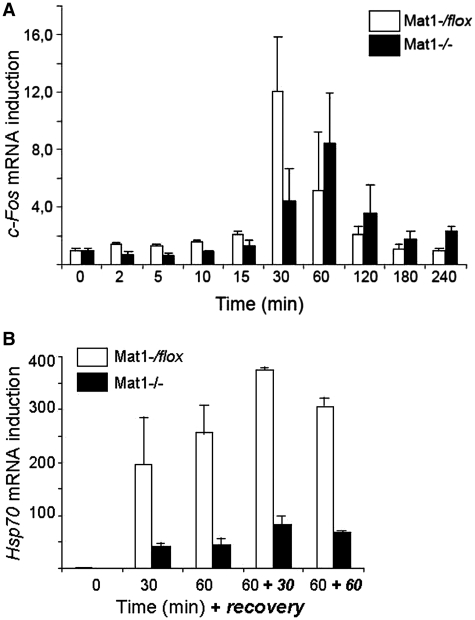
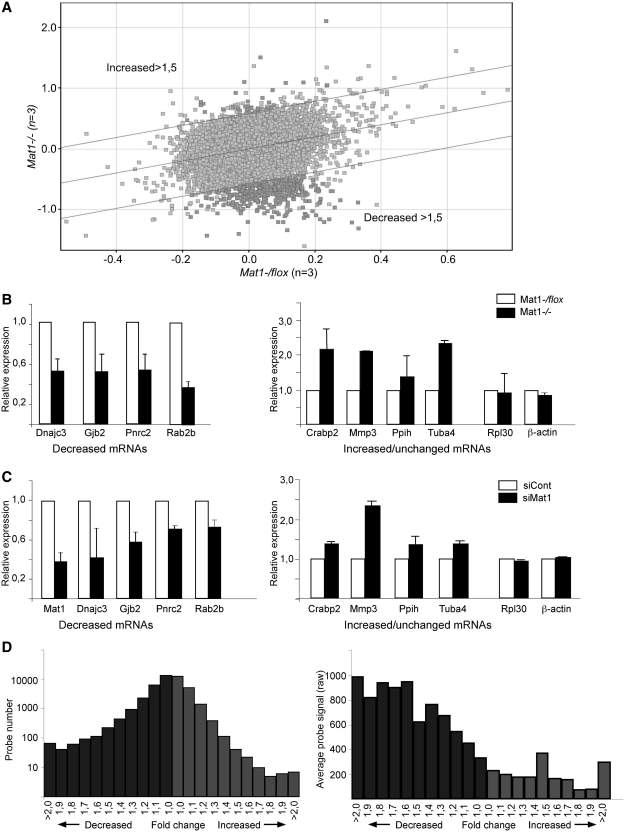
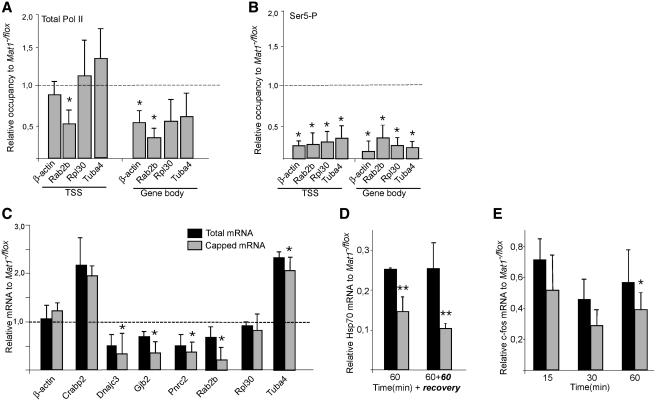
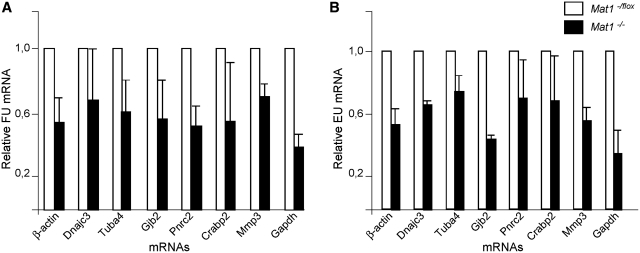
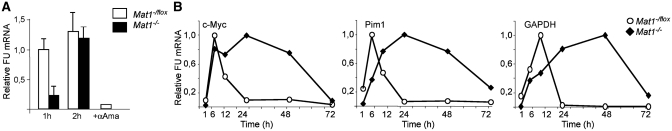
The relevance of serine 5 phosphorylation of RNA polymerase II carboxy-terminal domain during initiation has been difficult to determine in mammalian cells as no general in vivo Ser5 kinase has been identified. Here, we demonstrate that deletion of the TFIIH kinase subunit Mat1 in mouse fibroblasts leads to dramatically reduced Pol II Ser5 phosphorylation. This is associated with defective capping and reduced Ser2 phosphorylation, decreased Pol II progression into elongation and severely attenuated transcription detected through analysis of nascent mRNAs, establishing a general requirement for mammalian Mat1 in transcription. Surprisingly, the general defect in Pol II transcription in Mat1(-/-) fibroblasts is not reflected in the majority of steady-state mRNAs. This indicates widespread stabilization of mRNAs and points to the existence of a regulatory mechanism to stabilize mRNAs following transcriptional attenuation, thus revealing a potential caveat in similar studies limited to analysis of steady-state mRNAs.


Figures

Figure 1.
Figure 1.
Mat1 is required for Ser5 and Ser2 phosphorylation. (A) Western blotting analysis Mat1/flox MEFs with antibodies against indicated TFIIH subunits or actin as a loading control 72 h after infection with AdCre (−/−) or control virus (−/flox). (B) Western blotting analysis as in (A) using antibodies against Pol II Ser5-P (H14), Ser2-P (H5) or total Pol II (N20). (C) Immunostaining of Mat1/flox and Mat1/ MEFs with antibodies against Pol II Ser5-P (H14), Ser2-P (H5) or total Pol II (N20). DAPI staining is shown to identify nuclei in merged panels. Columns on right indicate the average intensity of signal from Ser5-P and Ser2-P in Mat1/ MEFs (black bars with ratios shown as number on top) relative to Mat1/flox MEFs (white bars) in three biological replicates with error bars showing standard between replicates.
Figure 2.
Figure 2.
Deficient c-Fos and Hsp70 mRNA induction in Mat1/ MEFs. (A) c-Fos mRNA induction relative to 0 min following serum stimulation at indicated time points in Mat1/flox (white bars) and Mat1/ (black bars) MEFs. (B) Hsp70 mRNA induction relative to 0 min following heat shocks at 42°C for 30 or 60 min, or after a recovery of 30 or 60 min as indicated in Mat1/flox (white bars) and Mat1/ (black bars) MEFs. Error bars indicate standard deviation in three independent experiments. All mRNAs were normalized to Gapdh mRNA levels.
Figure 3.
Figure 3.
Genome-wide alterations in mRNA levels following Mat1 deletion. (A) Scatter plot of Affymetrix MG430 2.0 average probe set signals plotted according to genotype as indicated, with lines delineating probe sets >1.5-fold increased or decreased in Mat1/ samples as indicated. Probe sets differing significantly (P < 0.05) according to genotype are highlighted in dark gray. (B) mRNA levels of indicated genes in Mat1/ samples (black bars) relative to control (white bars) assessed by qRT-PCR grouped to genes decreased, increased or unchanged (Rpl30 and Actb) in Affymetrix analysis. Error bars indicate standard deviation between at least five experiments. (C) Analysis of indicated mRNA levels as in (B) from MEFs transfected with control (siCont) or Mat1 targeting siRNAs (siMat1). Error bars indicate standard deviation between four experiments. (D) Distribution of Affymetrix probe sets (see A) according to fold change (0.1-fold change increments) in Mat1/ samples with decreased samples in dark gray and increased in light gray. Note that probe set numbers are plotted on a logarithmic scale. (E) Distribution of average probe signal (raw) in categories described in (D) demonstrating that probe sets with stronger signal are significantly more likely to demonstrate decreased signal in Mat1/ samples.
Figure 4.
Figure 4.
Reduced levels of elongating Pol II and deficient capping following Mat1 deletion (A and B) Chromatin immunoprecipitation (ChIP) analysis from Mat1/flox and Mat1/ MEF lysates with antibodies recognizing total Pol II (N20) and Ser5-P Pol II (ab5131). ChIP-enriched DNA was quantified by qPCR with primers amplifying transcription start site (TSS) and gene bodies of the indicated genes. Columns indicate relative levels of Pol II in Mat1/ samples comparedwith Mat1/flox levels (indicated as dotted line). Error bars indicate standard deviation within three biological replicates and asterisks indicate statistically significant alterations (P < 0.05). (C) Relative levels of m7G-capped (gray columns) and total mRNA of indicated genes in Mat1/ MEFs compared to Mat1/flox levels (indicated as dotted line). Levels of capped mRNAs were determined by qRT-PCR from RNA immunoprecipitated with an α-m7Gcap antibody (H2O) and levels of total mRNAs were quantitated with qRT-PCR from the same experiments. (D) Total and capped Hsp70 mRNA levels following a 1 h heat shock and 1 h recovery showing total and capped mRNA levels in Mat1/ MEFs in relation to Mat1/flox MEFs. (E) Total and capped c-Fos mRNA levels from samples collected at indicated time points following a serum stimulation analyzed as in (C). All bars in (A–C) represent averages from three independent experiments, with standard deviations as error bars.
Figure 5.
Figure 5.
Nascent mRNA analysis reveals requirement of Mat1 for Pol II transcription. (A) Analysis of levels of FU-labeled mRNAs from Mat1/ cells (black bars) relative to Mat1/flox samples (white bar). Mat1/flox and Mat1/ cells exposed to a 10-min FU pulse followed by a 1-h chase were used for RNA isolation and subsequent immunoprecipitation with an antibody recognizing halogenated uridine. Columns indicate relative amounts of mRNAs in immunoprecipitates quantified by qRT-PCR compared with Mat1/flox. Error bars indicate standard deviation from biological triplicates. (B) Analysis of levels of 5-ethynyluridine (EU) labeled mRNAs from Mat1/ cells chased for 1 h prior to lysis and purification of EU-labeled RNA using click-chemistry based biotin cross-linking. Values are shown relative to Mat1/flox samples (white bar). Error bars indicate standard deviation in three independent experiments.
Figure 6.
Figure 6.
Stabilization of mRNAs in Mat1/ MEFs. (A) Mat1/flox and Mat1/ cells exposed to a 10-min FU pulse followed by a 1 or 2 h chase analyzed for nascent FU-labeled RNA as in Figure 5 demonstrate almost comparable amounts of labeled RNA after a 2-h chase in Mat1/flox and Mat1/ cells. α-Amanitin treated wild-type MEFs chased for 2 h are used as control. Error bars indicate standard deviation in three independent experiments. (B) Levels of three FU-labeled mRNAs (c-Myc, Pim1 and Gapdh) from Mat1/flox (white circles) and Mat1/ (black diamonds) MEFs quantified by qRT-PCR at various time points after 10 min FU pulse. FU mRNA values are relative to the highest value within experiment.

References

    1. Saunders A, Core LJ, Lis JT. Breaking barriers to transcription elongation. Nat. Rev. 2006;7:557–567. - PubMed
    1. Tirode F, Busso D, Coin F, Egly JM. Reconstitution of the transcription factor TFIIH: assignment of functions for the three enzymatic subunits, XPB, XPD, and cdk7. Mol. Cell. 1999;3:87–95. - PubMed
    1. Coin F, Oksenych V, Mocquet V, Groh S, Blattner C, Egly JM. Nucleotide excision repair driven by the dissociation of CAK from TFIIH. Mol. Cell. 2008;31:9–20. - PubMed
    1. Roy R, Adamczewski JP, Seroz T, Vermeulen W, Tassan JP, Schaeffer L, Nigg EA, Hoeijmakers JH, Egly JM. The MO15 cell cycle kinase is associated with the TFIIH transcription- DNA repair factor. Cell. 1994;79:1093–1101. - PubMed
    1. Serizawa H, Makela TP, Conaway JW, Conaway RC, Weinberg RA, Young RA. Association of Cdk-activating kinase subunits with transcription factor TFIIH. Nature. 1995;374:280–282. - PubMed

Publication types

MeSH terms