. 2011 Apr 28;117(17):4501-10.
doi: 10.1182/blood-2010-10-310425. Epub 2011 Mar 8.

Coexpression of Tim-3 and PD-1 identifies a CD8+ T-cell exhaustion phenotype in mice with disseminated acute myelogenous leukemia

Affiliations

Coexpression of Tim-3 and PD-1 identifies a CD8+ T-cell exhaustion phenotype in mice with disseminated acute myelogenous leukemia

Qing Zhou et al. Blood. .

Abstract

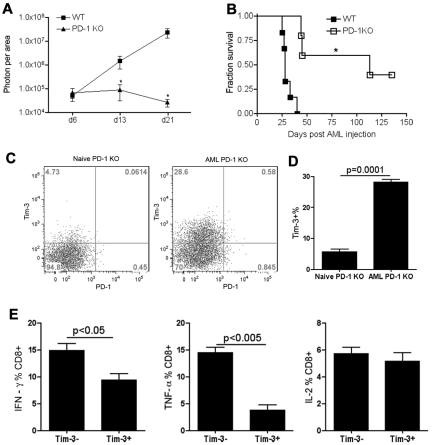
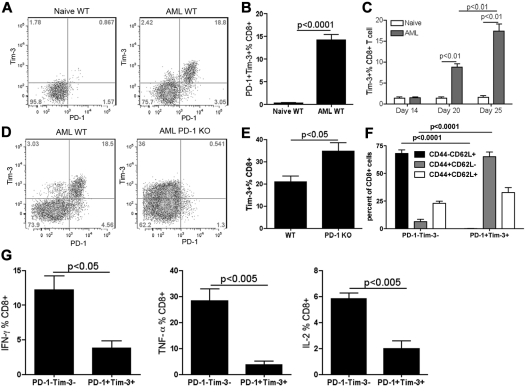
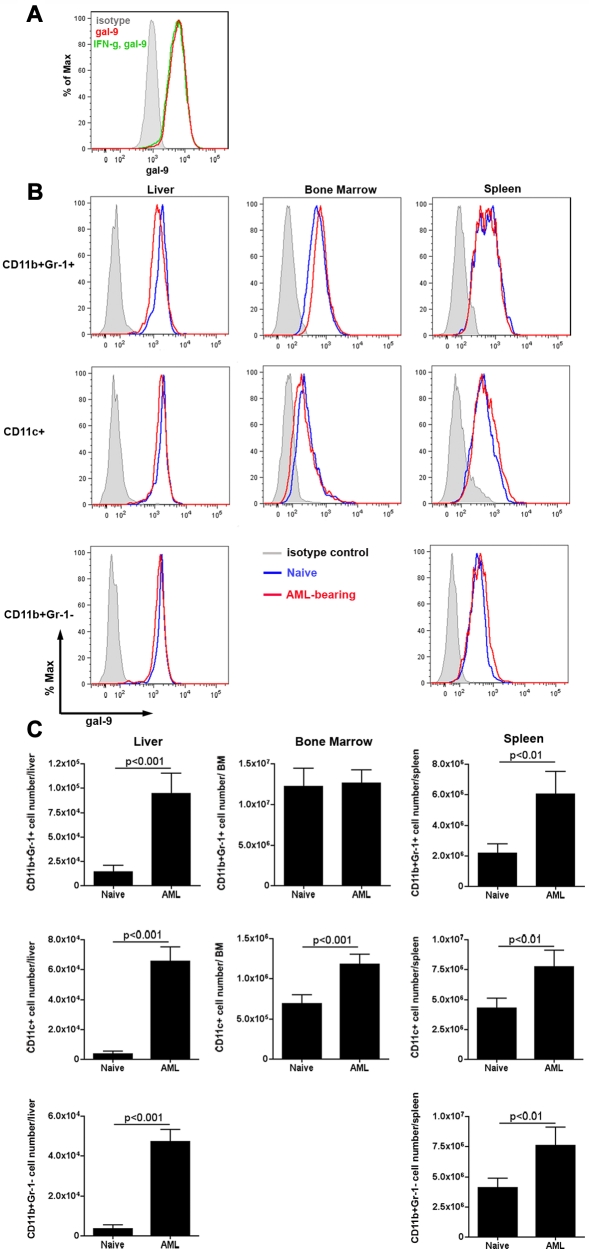
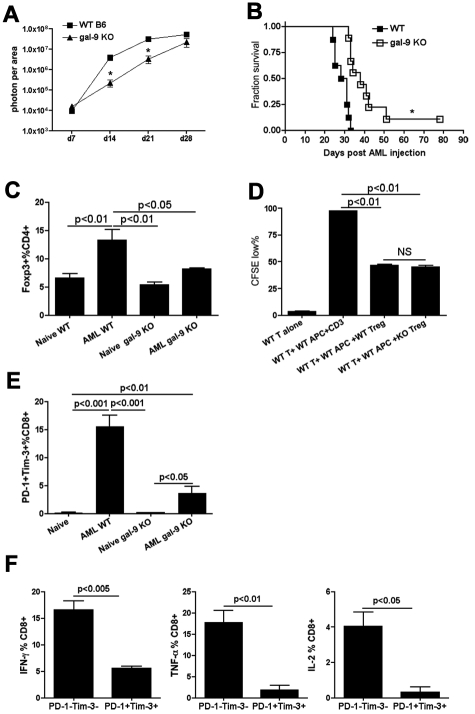
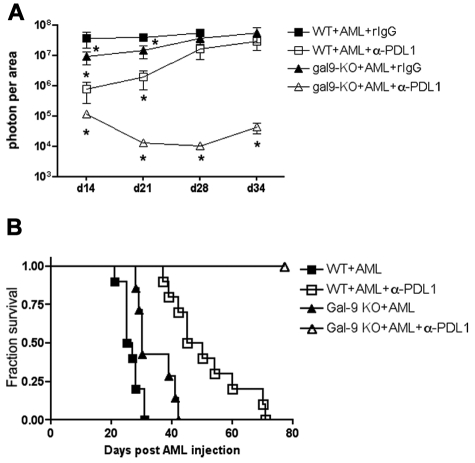
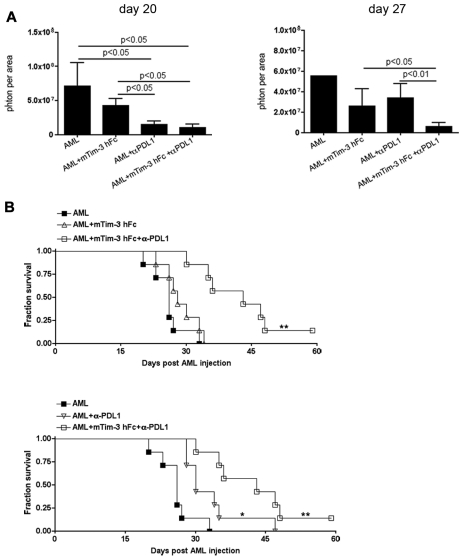
Tumor-associated immune suppression can lead to defective T cell-mediated antitumor immunity. Here, we identified a unique phenotype of exhausted T cells in mice with advanced acute myelogenous leukemia (AML). This phenotype is characterized by the coexpression of Tim-3 and PD-1 on CD8(+) T cells in the liver, the major first site of AML metastases. PD-1 and Tim-3 coexpression increased during AML progression. PD-1(+)Tim-3(+) CD8(+) T cells were deficient in their ability to produce IFN-γ, TNF-α, and IL-2 in response to PD-1 ligand (PDL1) and Tim-3 ligand (galectin-9) expressing AML cells. PD-1 knockout (KO), which were partially resistant to AML challenge, up-regulated Tim-3 during AML progression and such Tim-3(+)PD-1- KO CD8(+) T cells had reduced cytokine production. Galectin-9 KO mice were more resistant to AML, which was associated with reduced T-regulatory cell accumulation and a modest induction of PD-1 and Tim-3 expression on CD8(+) T cells. Whereas blocking the PD-1/PDL1 or Tim-3/galectin-9 pathway alone was insufficient to rescue mice from AML lethality, an additive effect was seen in reducing-albeit not eliminating-both tumor burden and lethality when both pathways were blocked. Therefore, combined PD-1/PDL1 and Tim-3/galectin-9 blockade may be beneficial in preventing CD8(+) T-cell exhaustion in patients with hematologic malignancies such as advanced AML.


Figures

Figure 1
Figure 1
AML-induced Tim-3–expressing liver CD8+ T cells in PD-1 KO mice were dysfunctional. (A-B) WT or PD-1 KO mice (10 mice/group) were injected with 106 C1498FFDsR through the tail vein. (A) Whole-body imaging was performed 7, 14, and 21 days post-AML injection. PD-1 KO mice had decelerated tumor growth compared with WT controls. *P < .01 compared with WT controls. (B) Significant prolonged surviving time with partial survival from AML was attained in PD-1 KO mice. *P < .001 compared with WT controls. (C-E) Naive or AML-bearing PD-1 KO mice (3-4 mice/group) were killed 25 days post-AML injection. Liver leukocytes were isolated. Tim-3 and intracellular cytokine production was determined by FACS. Tim-3 expression induced by AML on the liver CD8+ T cells in PD-1 KO mice 25 days post-AML injection is shown in flow dot plot (C) and bar graph (D). (E) Tim-3+CD8+ T cells from PD-1 KO mice were deficient in producing IFN-γ, TNF-α but not IL-2 compared with Tim-3 fraction.
Figure 2
Figure 2
AML-induced PD-1+Tim-3+ liver CD8+ T cells in WT mice were dysfunctional. (A-C) B6 WT mice were injected intravenously with 106 C1498FFDsR. Liver leukocytes were isolated 14, 20, and 25 days post-AML injection. PD-1 and Tim-3 expression was determined by FACS. PD-1 and Tim-3 coexpression detected on liver CD8+ T cells 25 days post-AML injection is shown in flow dot plot (A) and bar graph (B). (C) Time course of Tim-3 expression on liver CD8+ T cells as AML progression in mice is shown. Tim-3 was up-regulated at a late phase of disease (day 20 and 25 but not day 14). (D-F) WT and PD-1 KO mice (3-4 mice/group) were injected with 106 C1498FFDsR. Liver leukocytes were isolated 25 days post-AML injection. PD-1, Tim-3, CD44, CD62L, and intracellular cytokine production was determined by flow cytometry. (D-E) Tim-3 was expressed at a higher level in PD-1 KO mice compared with WT mice. (F) Majority of PD-1+Tim-3+ CD8+ T cells was CD44+CD62L, while PD-1Tim-3 CD8+ T cells were mainly CD44CD62L+. (G) PD-1– and Tim-3–coexpressing CD8+ T cells from WT mice are highly deficient in producing IFN-γ, TNF-α and IL-2 compared with PD-1-Tim-3- fraction. Data were pooled from 2 individual experiments.
Figure 3
Figure 3
Gal-9 is expressed on C1498FFDsR cells and immune cells. C1498FFDsR cells were untreated or treated with IFN-γ (1000 ng/mL) for 48 hours. Gal-9 expression was assessed by flow cytometry as described. (A) C1498FFDsR cells express gal-9 (> 90%). IFN-γ treatment (1000 U/mL, 48 hours) did not alter the expression of gal-9 on C1498FFDsR cells. B6 mice were injected intravenously with 106 C1498FFDsR. (B-C) Leukocytes from the liver, BM, and spleen of either naive or AML-bearing B6 mice (4 mice/group, 25 days post-AML injection) were prepared. Gal-9 expression was determined by flow cytometry. (B) Flow histogram graph of gal-9 expression on CD11b+Gr-1+, CD11c+, and CD11b+Gr-1 cells from the liver, BM, and spleen are shown. Gal-9 is expressed on all 3 types of cells in various organs measured (blue). The presence of AML (red) did not change the pattern of gal-9 expression (blue) in all 3 organs. (C) Bar graphs of the total number of gal-9 expressing CD11b+Gr-1+, CD11c+, and CD11b+Gr-1 cells in the liver, BM, and spleen from naive or AML-bearing mice are shown.
Figure 4
Figure 4
Gal-9 KO mice were more resistant to AML. (A-B) B6 WT or gal-9 KO mice (10 mice/group) were injected intravenously with 106 C1498FFDsR. (A) Whole-body imaging was performed on 7, 14, 21, and 28 days post-AML injection (10 mice/group). Gal-9 KO mice had a slower tumor growth compared with WT mice 14 and 21 days post-AML injection. Tumor burden was equal at a later phase of disease (day 28). (B) gal-9 KO mice had a significant prolonged survival from AML. (C-E) Naive or AML-bearing gal-9 KO mice (3-4 mice/group) were killed 25 days post-AML injection. Liver leukocytes were isolated for flow cytometry. (C) The percentage of Foxp3+ Tregs in CD4+ T cells from liver of AML-bearing gal-9 KO mice was similar to naive WT or gal-9 KO mice, while AML induced an increase in percentage of Foxp3+ Tregs in WT mice. (D) An in vitro Treg suppression assay was performed with WT and gal-9 KO Tregs. Gal-9 KO Tregs could inhibit CD8+ T cells proliferation at a comparable level to WT Tregs. Data were pooled from 2 individual experiments (7 mice total). (E) The percentage of PD-1+Tim-3+ CD8+T cells was increased in the liver of AML-bearing gal-9 KO mice but to a lesser extent than in AML-bearing WT mice. Data were pooled from 2 individual experiments (7 mice total). (F) Impaired IFN-γ, TNF-α, and IL-2 production was found in PD-1+Tim-3+ CD8+ T cells in AML-bearing gal-9 KO mice. Data were pooled from 2 individual experiments (6 mice total).
Figure 5
Figure 5
Anti-PDL1 mAb treatment restored CD8+ T-cell function and rescued gal-9 KO mice from AML. WT or gal-9 KO mice (10 mice/group) were injected iv with 106 C1498FFDsR cells. Anti-PDL1 mAb or control rIgG was administered as described. (A) Anti-PDL1 mAb treatment significantly reduced tumor burdens in WT mice 14 and 21 days post-AML injection. Gal-9 KO mice had a more dramatic decrease in tumor burdens on days 14, 21, 28, and 34, compared with WT mice. (B) Anti-PDL1 treatment prolonged the survival of AML-bearing WT mice (□ vs ■, P < .0001). Gal-9 KO mice had an increased survival from AML compared with WT mice (▴ vs ■, P < .05). Gal-9 KO mice were protected from AML by anti-PDL1 treatment and remained tumor-free by 60 days (▵ vs ■, P < .0001).
Figure 6
Figure 6
Combined mTim-3 hFc and anti-PDL1 treatment had an additive antitumor effect in an established AML model. B6 mice (10 mice/group) were injected iv with 1 × 10⁶ C1498FFDsR cells. Ten days after AML injection, mice were treated with mTim-3 hFc (100 μg/dose), anti-PD-L1 (200 μg/dose) or combination of both every other day for total of 5 doses. (A) Bioluminescence imaging was performed 14 (not shown), 20 and 27 days post-AML injection (10 mice/group). Mice treated with mTim-3 hFc alone had similar tumor burden to nontreated controls. Anti-PD-L1 mAb single treatment significantly reduced tumor burden on days 14 (not shown) and 20. Mice receiving the combination therapy had decreased tumor burdens at all 3 time points. (B) mTim-3 hFc treatment did not alter the survival of AML-bearing mice. Anti-PD-L1 mAb alone significantly prolonged survival from AML compared with controls (▿ vs ■, P < .01). Combined therapy had superior effect on the survival over either treatment alone (□ vs ▵ and ▿, P < .01). Survival analysis was plotted according to the Kaplan-Meier method, and statistical differences were determined with the log-rank test. Error bar represents SEM.

References

    1. Zajac AJ, Blattman JN, Murali-Krishna K, et al. Viral immune evasion due to persistence of activated T cells without effector function. J Exp Med. 1998;188(12):2205–2213. - PMC - PubMed
    1. Urbani S, Amadei B, Tola D, et al. PD-1 expression in acute hepatitis C virus (HCV) infection is associated with HCV-specific CD8 exhaustion. J Virol. 2006;80(22):11398–11403. - PMC - PubMed
    1. Freeman GJ, Wherry EJ, Ahmed R, Sharpe AH. Reinvigorating exhausted HIV-specific T cells via PD-1-PD-1 ligand blockade. J Exp Med. 2006;203(10):2223–2227. - PMC - PubMed
    1. Nakamoto N, Cho H, Shaked A, et al. Synergistic reversal of intrahepatic HCV-specific CD8 T cell exhaustion by combined PD-1/CTLA-4 blockade. PLoS Pathog. 2009;5(2):e1000313. - PMC - PubMed
    1. Barber DL, Wherry EJ, Masopust D, et al. Restoring function in exhausted CD8 T cells during chronic viral infection. Nature. 2006;439(7077):682–687. - PubMed

Publication types

MeSH terms