. 2011 May 13;286(19):16846-60.
doi: 10.1074/jbc.M110.187559. Epub 2011 Mar 8.

Angiogenic functions of voltage-gated Na+ Channels in human endothelial cells: modulation of vascular endothelial growth factor (VEGF) signaling

Affiliations

Angiogenic functions of voltage-gated Na+ Channels in human endothelial cells: modulation of vascular endothelial growth factor (VEGF) signaling

Petros Andrikopoulos et al. J Biol Chem. .

Abstract

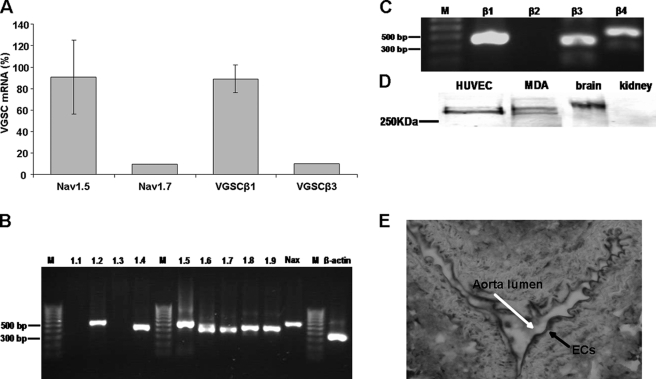
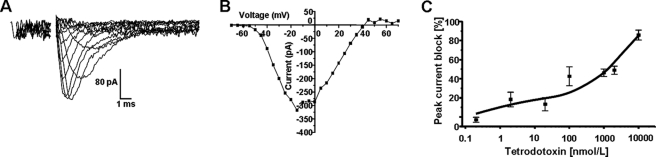
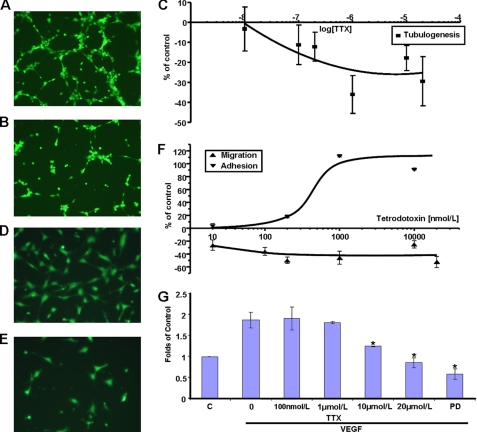
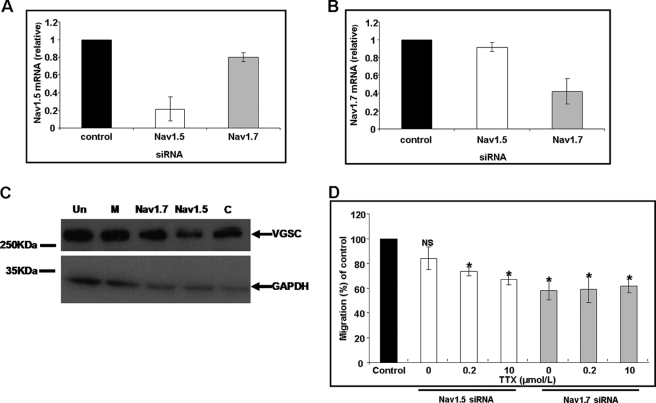
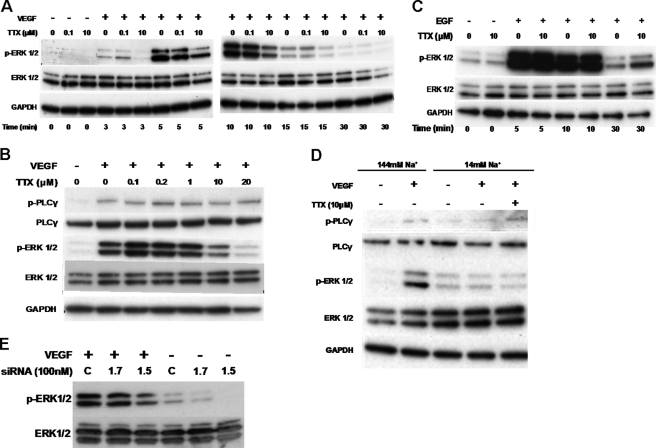
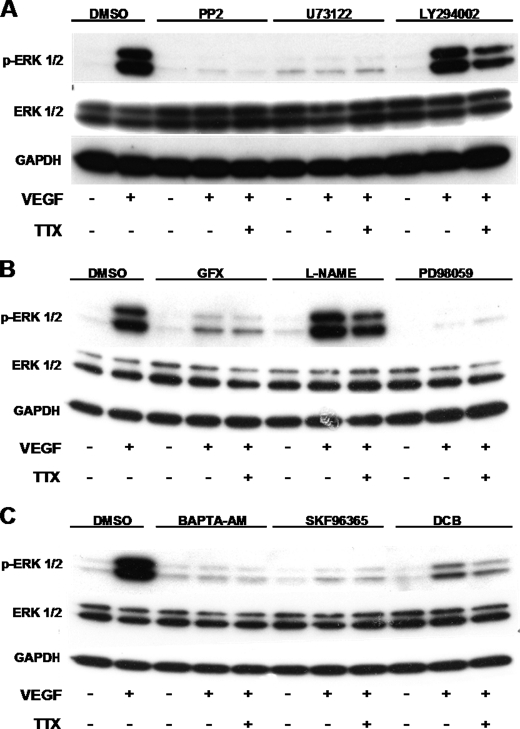
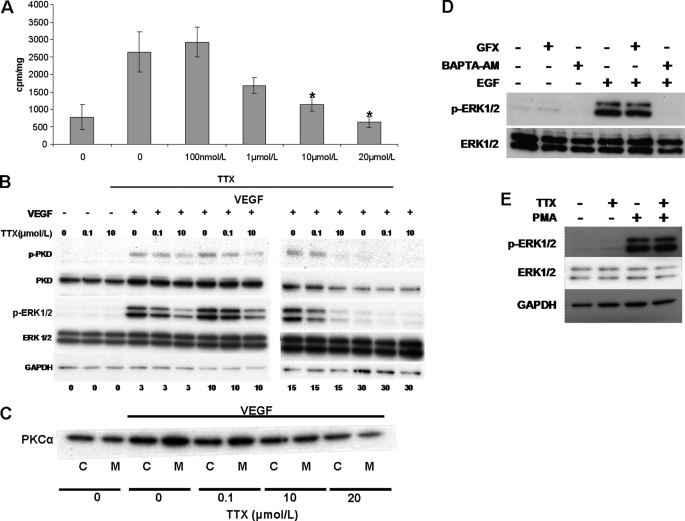
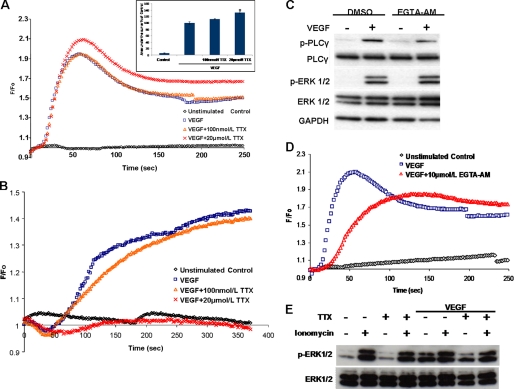
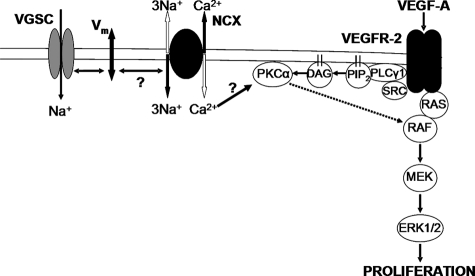
Voltage-gated sodium channel (VGSC) activity has previously been reported in endothelial cells (ECs). However, the exact isoforms of VGSCs present, their mode(s) of action, and potential role(s) in angiogenesis have not been investigated. The main aims of this study were to determine the role of VGSC activity in angiogenic functions and to elucidate the potentially associated signaling mechanisms using human umbilical vein endothelial cells (HUVECs) as a model system. Real-time PCR showed that the primary functional VGSC α- and β-subunit isoforms in HUVECs were Nav1.5, Nav1.7, VGSCβ1, and VGSCβ3. Western blots verified that VGSCα proteins were expressed in HUVECs, and immunohistochemistry revealed VGSCα expression in mouse aortic ECs in vivo. Electrophysiological recordings showed that the channels were functional and suppressed by tetrodotoxin (TTX). VGSC activity modulated the following angiogenic properties of HUVECs: VEGF-induced proliferation or chemotaxis, tubular differentiation, and substrate adhesion. Interestingly, different aspects of angiogenesis were controlled by the different VGSC isoforms based on TTX sensitivity and effects of siRNA-mediated gene silencing. Additionally, we show for the first time that TTX-resistant (TTX-R) VGSCs (Nav1.5) potentiate VEGF-induced ERK1/2 activation through the PKCα-B-RAF signaling axis. We postulate that this potentiation occurs through modulation of VEGF-induced HUVEC depolarization and [Ca(2+)](i). We conclude that VGSCs regulate multiple angiogenic functions and VEGF signaling in HUVECs. Our results imply that targeting VGSC expression/activity could be a novel strategy for controlling angiogenesis.


Figures

FIGURE 1.
FIGURE 1.
PCR and Western blots for VGSCα/β expression in HUVECs. A, semiquantified relative (%) levels of mRNA of the major VGSCα and VGSCβ isoforms. Data are presented as mean ± S.E. The expression level of the predominant VGSC subunit is expressed as a percentage of the total respective VGSCα/β mRNA levels. Error bars represent the propagated errors (2−ΔΔCT analysis). Shown is mRNA expression of VGSCα isoforms (B) and VGSCβ isoforms (C). D, Western blot showing VGSCα protein. E, immunohistochemical staining with a pan-VGSC antibody of mouse aorta. Black arrow, endothelial cells; white arrow, the aortic lumen.
FIGURE 2.
FIGURE 2.
VGSC activity in HUVECs. A, electrophysiological whole-cell recordings. Traces show activation of an inward current by applying 5-mV steps, from −70 mV to +70 mV, from a holding potential of −100 mV, with an interpulse interval of 2 s. Alternate traces only are shown for clarity. B, a typical current-voltage relationship for the inward currents recorded as in A. C, TTX dose-response curve. Data points denote means ± S.E. (error bars) (n ≥ 4). Cells were pulsed from a holding potential of −100 mV to −10 mV for 30 ms with a repeat interval of 10 s. The effect of TTX was recorded on the fifth pulse. The intracellular pipette solution contained Cs+ to block outward (K+) currents in all recordings shown.
FIGURE 3.
FIGURE 3.
Effects of TTX on HUVEC functions. Representative photomicrographs of HUVECs plated onto MatrigelTM. A, control; B, 1 μmol/liter TTX. C, quantification of tubule length at 4 h relative to controls. Representative photomicrographs of HUVECs migrated through Transwell filters toward VEGF. D, control. E, 200 nmol/liter TTX. F, migration (▴) was measured at 16 h, and adhesion (▾) was measured at 24 h. Data points denote mean ± S.E. (n = 3–5). G, HUVEC proliferation assay. Cells were exposed to VEGF for 72 h in the presence of TTX or PD98059, as indicated. C, unstimulated controls; absorbance set at 1. Bars, represent mean ± S.E. (error bars) (n = 3 in triplicate). *, p < 0.05 versus controls.
FIGURE 4.
FIGURE 4.
Effect of VGSC (Nav1.5 and Nav1.7) siRNAs on chemotaxis. mRNA measurements following treatments of HUVECs with Nav1.5 (A) and Nav1.7 (B) siRNA. Normalized levels of mRNA at 72 h relative to cells transfected with non-targeting siRNA are shown. White bars, Nav1.5 siRNA-transfected HUVECs. Gray bars, Nav1.7 siRNA-transfected HUVECs. Bars, mean ± S.E. from 2−ΔΔCT analysis (n = 3). C, representative Western blots of proteins from siRNA-treated HUVECs using a pan-VGSC primary antibody and GAPDH. Un, untreated; M, mock-transfected; other lane labels are as in A. D, Transwell chemotaxis of HUVECs treated with Nav1.5 or Nav1.7 siRNA. Data are shown as percentage controls. Samples are as in A but also showing the effect of TTX applied post-transfection. Each bar denotes mean ± S.E. (error bars) (n = 3). *, p < 0.05.
FIGURE 5.
FIGURE 5.
TTX inhibits ERK1/2 activation upon VEGF stimulation of HUVEC. HUVECs were incubated with VEGF in the presence of TTX for the indicated times. A, Western blots of phospho-ERK1/2, total ERK1/2, and GAPDH (n = 4). B, phospho-PLCγ1, total PLCγ, p-ERK/12, and total ERK levels (n = 3). C, HUVECs were incubated with EGF in the presence of TTX as indicated, and blots were probed as in A (n = 3). D, HUVECs were stimulated with VEGF in a “low Na+” medium; ERK1/2 and PLCγ1 activation were analyzed as before (n = 3). E, representative Western blot of phosphorylated and total ERK1/2 from HUVECs transfected with siRNA (100 nm), serum-starved and challenged with VEGF (50 ng/ml for 10 min). Un, untreated; M, mock-transfected; 1.7, Nav1.7 siRNA; 1.5, Nav1.5 siRNA.
FIGURE 6.
FIGURE 6.
VEGF activates ERK1/2 through a pathway that involves Src, PLCγ, PKC, and Ca2+. HUVECs were treated with 1 μm Src inhibitor PP2, 1 μm PLC inhibitor, 30 μm PI3K inhibitor LY294002 (A); 1 μm PKC inhibitor GF109203X, 1 mm general NOS inhibitor l-NAME, 30 μm MEK inhibitor PD98059 (B); 10 μm cell-permeable Ca2+ chelator BAPTA-AM, 50 μm inhibitor of non-selective cation channels SKF-96365, or 30 μm NCX inhibitor DCB (C) for 30 min before exposure to 50 ng/ml VEGF. 10 μm TTX was added to the indicated samples for 10 min before stimulation with VEGF for 10 min. VEGF-induced ERK1/2 activation in cell lysates was determined by Western blot as described in the legend to Fig. 5 (n = 3).
FIGURE 7.
FIGURE 7.
Micromolar concentrations of TTX inhibit VEGF-induced B-Raf activation, PKCμ/PKD phosphorylation, and PKCα translocation to the membrane fraction. HUVECs were stimulated with VEGF with or without TTX. A, B-Raf was immunoprecipitated from cell extracts, and activity was assayed using a B-Raf kinase assay kit (Upstate). Bars, mean ± S.E. cpm/mg protein (n = 4). *, p < 0.05 versus VEGF-stimulated control. B, blots show phospho-PKD, total PKD, phospho-ERK1/2, total ERK, and GAPDH (n = 3). C, PKCα distribution to cytosolic (C) or membrane (M) fractions obtained by ultracentrifugation of HUVEC cell lysates. (n = 3). D, HUVECs were treated with the PKC inhibitor GFX109203X or the cell-permeable Ca2+ chelator BAPTA-AM as described in Fig. 6. EGF-induced ERK1/2 phosphorylation was determined by Western blot as in Fig. 5 (n = 3). E, serum-starved HUVECs were stimulated with phorbol 12-myristate 13-acetate (PMA) (1 μm for 10 min) in the presence or absence of TTX (10 μm)), and phospho-ERK1/2 was determined as described in the legend to Fig. 5.
FIGURE 8.
FIGURE 8.
Micromolar TTX enhances VEGF-induced Ca2+ transients and abolishes VEGF-induced membrane depolarization. A, time courses of Ca2+-sensitive Fluo-4NW fluorescence during VEGF stimulation of HUVECs. HUVECs were stimulated with VEGF at time 0. Shown are unstimulated control (black), VEGF-stimulated control (blue), and 100 nmol/liter or 20 μmol/liter TTX plus VEGF (orange and red, respectively) (n = 3, in triplicate). The area under the curve of the Ca2+ trace was calculated for each condition. The area under the curve of the VEGF-stimulated control was set to 100%. Bars, mean ± S.E. (n = 3 in triplicate). *, p < 0.05 versus VEGF-stimulated control. B, representative traces of membrane potential-sensitive DiBAC4(3) fluorescence recorded during VEGF stimulation of HUVECs (details and key are as in A) (n = 3, in triplicate). C, HUVECs were incubated with EGTA-AM (10 μm, 20 min) prior to VEGF stimulation. Phospho-ERK1/2 and phospho-PLCγ levels were analyzed as in Fig. 5. D, representative time courses of Ca2+-sensitive Fluo-4NW fluorescence recorded during VEGF stimulation of HUVECs loaded with EGTA-AM as in C. Traces of unstimulated (black), VEGF-stimulated (blue), and EGTA-AM-loaded plus VEGF (red) HUVECs were obtained as in A (n = 3, in triplicate). E, serum-starved HUVECs were stimulated with ionomycin (1 μm), VEGF (50 ng/ml), or both in the presence or absence of TTX (10 μm), and ERK1/2 activation was determined with Western blot as described in the legend to Fig. 5.
FIGURE 9.
FIGURE 9.
A mechanistic model for the role of VGSC activity in VEGF HUVEC signaling. Heavy lines show direct interactions. Dashed lines show indirect interactions. Voltage-gated sodium channel (VGSC) activity is proposed to influence the [Ca2+]i close to the plasma membrane by modifying the membrane potential and subsequently reverse-mode NCX exchange (Ca2+ in, Na+ out). DAG, diacylglycerol; PIP2, phosphatidylinositol 4,5-bisphosphate.

Similar articles

Cited by

References

    1. Carmeliet P. (2005) Nature 438, 932–936 - PubMed
    1. Chen C. H., Walterscheid J. P. (2006) Circ. Res. 99, 787–789 - PubMed
    1. Isner J. M. (2002) Nature 415, 234–239 - PubMed
    1. Semenza G. L. (2006) Circ. Res. 98, 1115–1116 - PubMed
    1. Olsson A. K., Dimberg A., Kreuger J., Claesson-Welsh L. (2006) Nat. Rev. Mol. Cell Biol. 7, 359–371 - PubMed

Publication types