. 2011 May 1;71(9):3387-99.
doi: 10.1158/0008-5472.CAN-10-4117. Epub 2011 Mar 8.

A developmental taxonomy of glioblastoma defined and maintained by MicroRNAs

Affiliations

A developmental taxonomy of glioblastoma defined and maintained by MicroRNAs

Tae-Min Kim et al. Cancer Res. .

Abstract

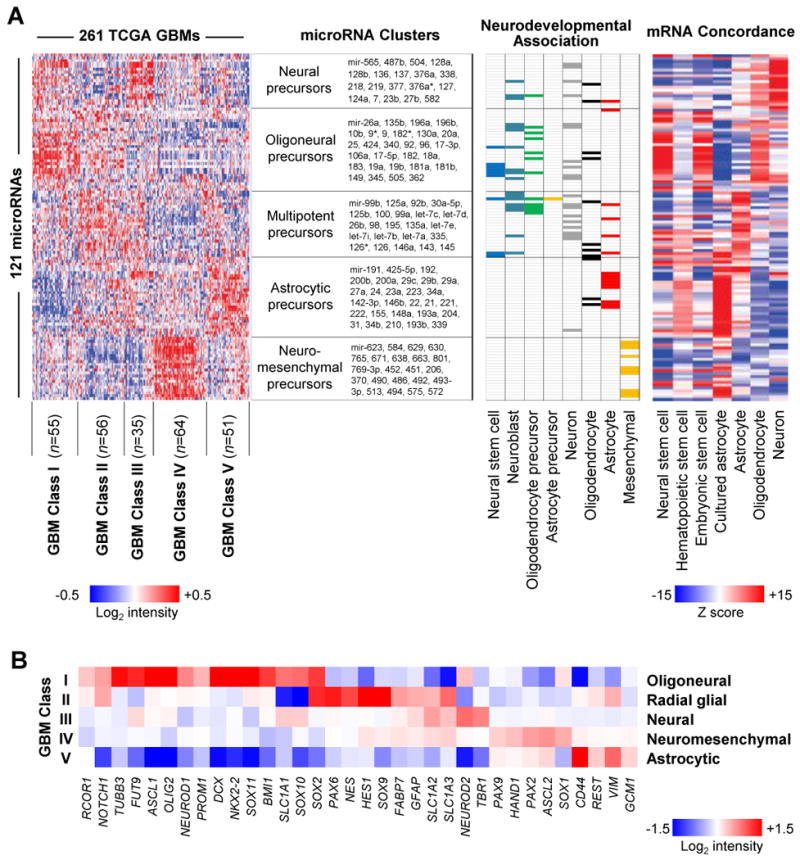
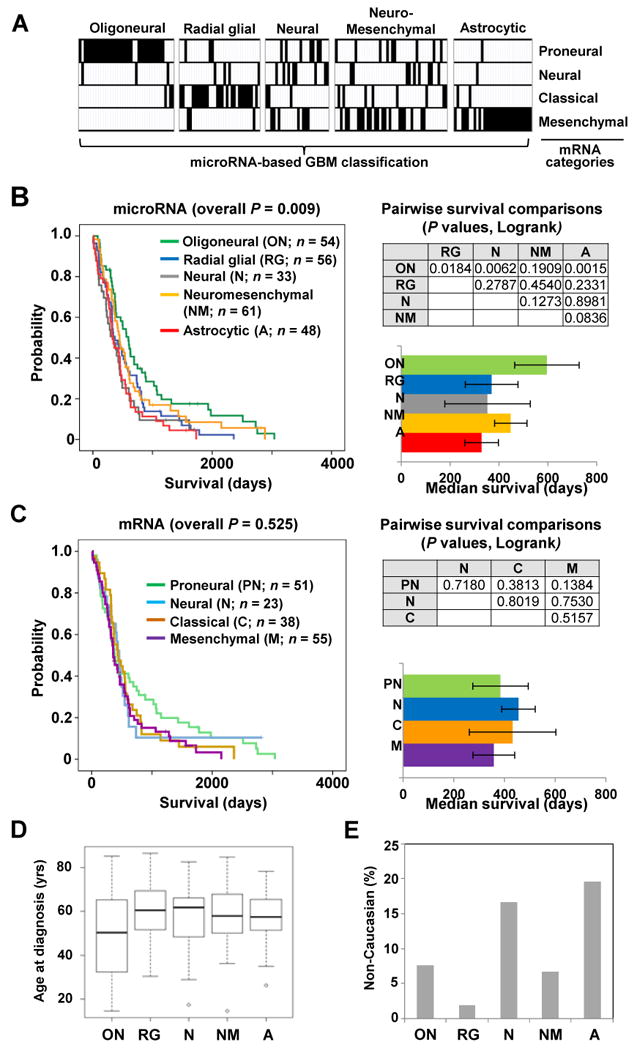
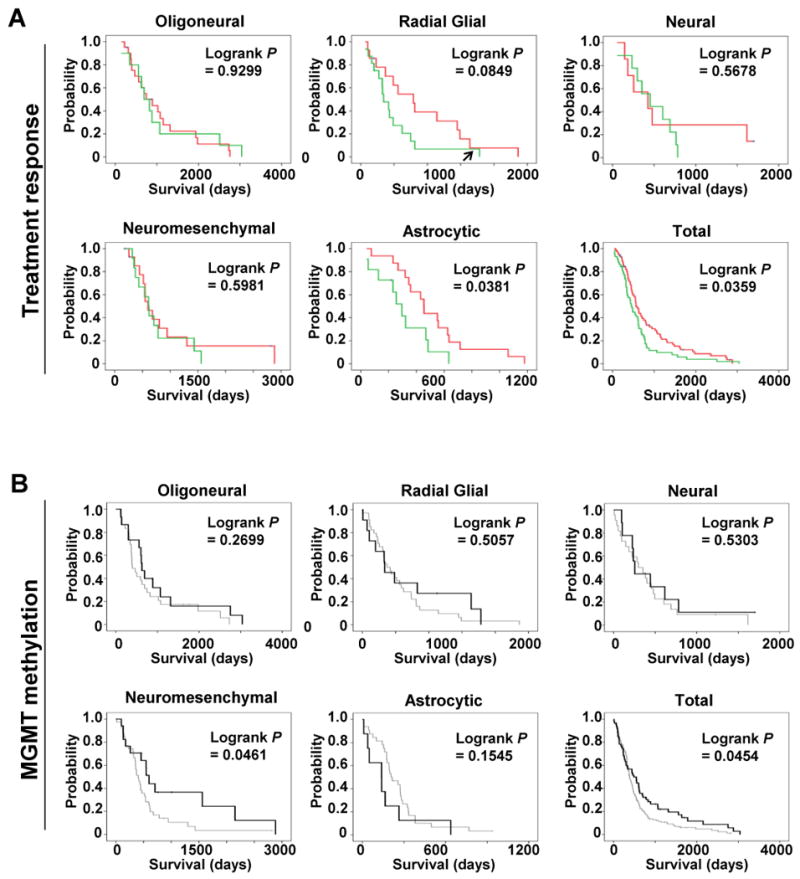
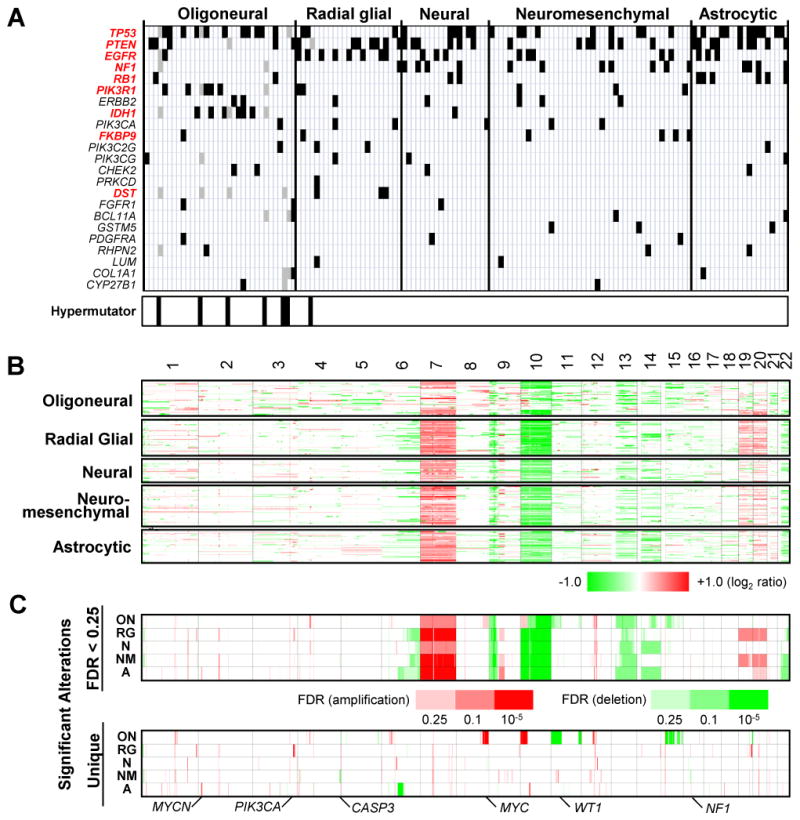
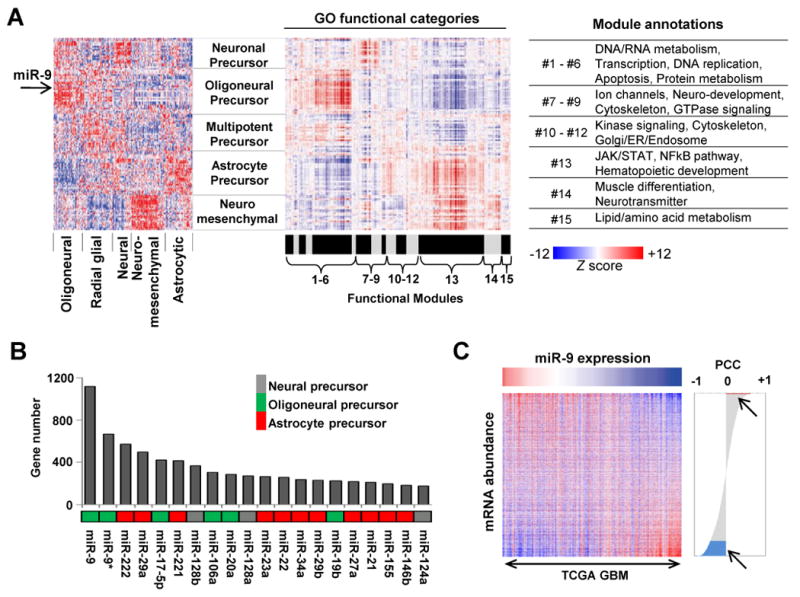
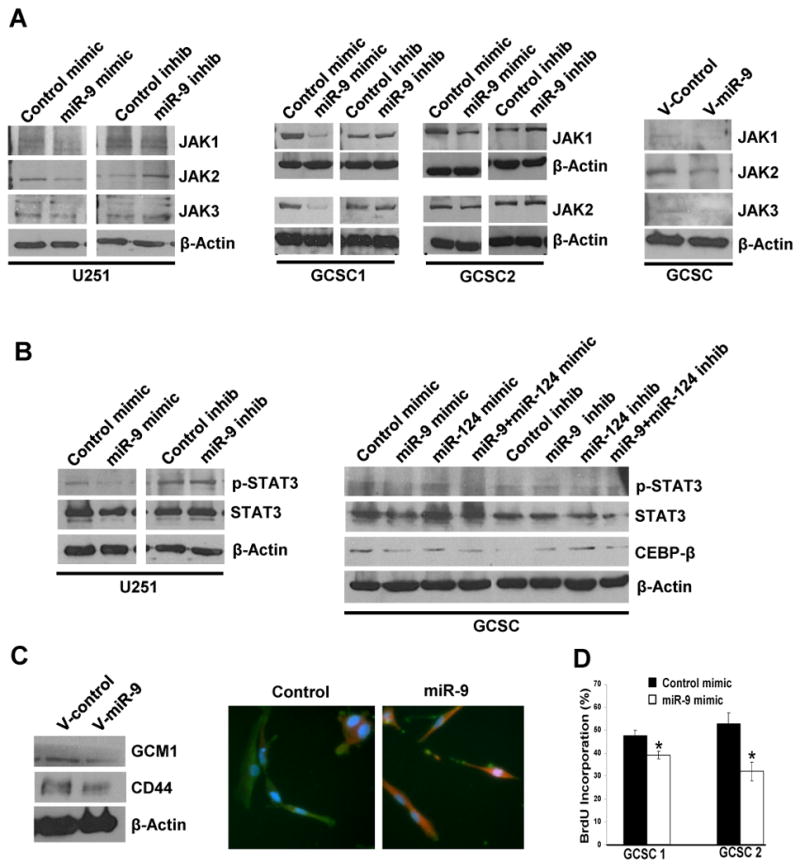
mRNA expression profiling has suggested the existence of multiple glioblastoma subclasses, but their number and characteristics vary among studies and the etiology underlying their development is unclear. In this study, we analyzed 261 microRNA expression profiles from The Cancer Genome Atlas (TCGA), identifying five clinically and genetically distinct subclasses of glioblastoma that each related to a different neural precursor cell type. These microRNA-based glioblastoma subclasses displayed microRNA and mRNA expression signatures resembling those of radial glia, oligoneuronal precursors, neuronal precursors, neuroepithelial/neural crest precursors, or astrocyte precursors. Each subclass was determined to be genetically distinct, based on the significant differences they displayed in terms of patient race, age, treatment response, and survival. We also identified several microRNAs as potent regulators of subclass-specific gene expression networks in glioblastoma. Foremost among these is miR-9, which suppresses mesenchymal differentiation in glioblastoma by downregulating expression of JAK kinases and inhibiting activation of STAT3. Our findings suggest that microRNAs are important determinants of glioblastoma subclasses through their ability to regulate developmental growth and differentiation programs in several transformed neural precursor cell types. Taken together, our results define developmental microRNA expression signatures that both characterize and contribute to the phenotypic diversity of glioblastoma subclasses, thereby providing an expanded framework for understanding the pathogenesis of glioblastoma in a human neurodevelopmental context.


Figures

Figure 1
Figure 1. MicroRNAs identify five neural precursor-related glioblastoma subclasses
(A) (left) Consensus clustering of 121 highly variable, survival-related or neurodevelopmentally-related microRNAs from 261 glioblastomas revealed five glioblastoma subclasses and five microRNA clusters (see also Supplementary Fig. S3). The neurodevelopmental annotations of the five microRNA clusters are shown along with the microRNAs contained within each cluster. Chart (middle) illustrates the association of selected microRNAs with eight different stages of neural cell differentiation (see also Supplementary Table S2). Heatmap (right) illustrates the extent of correlation between microRNAs and the mRNA signatures of neurons, oligodendrocytes, astrocytes and hematopoietic, embryonic or neural stem cells. Red and blue represent positive and negative correlation, respectively. The order of 121 microRNAs in the chart (middle) and the heatmap (left) is identical to that in the correlation heatmap (right). (B) The mRNA expression level of 34 neural differentiation markers among the five microRNA-based glioblastoma subclasses is illustrated in a heatmap.
Figure 2
Figure 2. Distinct clinical characteristics define glioblastoma subclasses
(A) The relationship between the microRNA-based glioblastoma subclassification scheme (vertical columns) and the previously published mRNA-based subclassification (horizontal rows) is shown using the same tumors for analysis. (B) (left) Kaplan-Meier survival plots for the five microRNA-based glioblastoma subclasses. (upper right) Table listing P values for survival differences calculated in a pairwise manner between microRNA-based subclasses. (lower right) The median survival of individual microRNA-based subclasses (error bar represents standard error of the mean). (C) Kaplan-Meier survival plots are shown for four mRNA-based glioblastoma subclasses (left) with the significance of survival differences between subclasses (upper right) and median survival (lower right). (D) Box plot illustrates the mean age at diagnosis for five microRNA-based glioblastoma subclasses (P < 0.001, ANOVA). (E) Graph illustrates percentage of Non-Caucasian (Asian and Black) patients in each glioblastoma subclass (P = 0.021, Fisher's exact).
Figure 3
Figure 3. Subclass-specific treatment response and the effect of MGMT methylation on survival
(A) Kaplan-Meier survival analyses for glioblastoma patients in each subclass or for the entire cohort are shown. The survival of patients treated with radiation (at least 54 Gy) and two or more cycles of temozolamide (red) versus all other regimens (green) are distinguished. Survival was calculated from the date of diagnosis. The arrow in the radial glial plot identifies a long-surviving outlier which, if excluded, P < 0.014, Logrank. (B) Kaplan-Meier survival analyses for glioblastoma patients in each subclass or for the entire cohort are shown. The survival of patients with tumors harboring MGMT promoter methylation was compared to those with tumors lacking MGMT methylation in each glioblastoma subclass. Black and grey lines represent the survival of patients with tumors with or without MGMT methylation, respectively.
Figure 4
Figure 4. Distinct genetic alterations characterize glioblastoma subclasses
(A) The distribution of somatic mutations is shown for 23 frequently mutated genes across five glioblastoma subclasses (black bars). Genes with significant differences in mutation frequency (P < 0.1, Fisher Exact test) are indicated in red. Each vertical column contains data from a single tumor. The location of seven hypermutator tumors is indicated at the bottom of the figure. Hypermutator mutations (gray bars) were excluded from significance calculations. (B) Genome-wide copy number alterations for 261 glioblastomas across five subclasses are illustrated in a heatmap. Red and green represent copy number gains and losses, respectively. (C) (upper panel) Significant alterations (false discovery rate or FDR < 0.25) are shown for five glioblastoma subclasses. The significance of recurrent alterations were measured using the GISTIC algorithm. (lower panel) Significant subclass-specific DNA alterations exclusive to each glioblastoma subclass are shown.
Figure 5
Figure 5. MicroRNAs regulate subclass-specific pathways
(A) The extent of correlation is calculated between 121 microRNAs and 1190 GO categories and rendered as a heatmap (middle panel). Red and blue represent positive or negative correlation between the corresponding microRNA and genes in the GO category, respectively. The correlation heatmap (middle panel) is shown along with the microRNA expression heatmap generated by consensus clustering (left panel, from Fig. 1A) for comparison. The location of miR-9 is indicated by an arrow. The 1190 GO categories are further separated into 15 modules with their respective functional annotations listed to the right. (B) The number of significantly correlated genes is plotted for the top 20 most highly connected microRNAs. The subclass-specific grouping of individual microRNAs is indicated using different colors. (C) The total number of genes (n = 11,861) is sorted in order of correlation with miR-9, placing the positively and negatively correlated genes at the top and bottom of the list, respectively. The heatmap shows the differences in mRNA expression of the sorted genes relative to the expression of miR-9. In the correlation plot, the red and blue areas (arrows) contain 32 positively- and 1184 negatively-correlated genes, respectively.
Figure 6
Figure 6. miR-9 regulates subclass differentiation in glioblastoma stem cells
(A) (left and middle panels) Western blot demonstrating JAK1, JAK2 and JAK3 protein expression in established U251 human glioblastoma cells or in primary human glioblastoma cancer stem cells (GCSCs) after exposure to the miR-9 mimic, miR-9 inhibitor or appropriate control oligonucleotides (100 μM). (right panel) JAK1, JAK2 or JAK3 protein expression in GCSCs after transduction using control (V-Control) or pri-miR-9 (V-miR-9) lentivirus. (B) (left panel) STAT3 and phosphorylated STAT3 in established U251 human glioblastoma cells after exposure to miR-9 mimic or inhibitor. (right panel) STAT3, phosphorylated STAT3 and CEBP-β protein expression in GCSCs after exposure to miR-9 or miR-124a mimic, inhibitor or oligonucleotide controls. (C) (left panel) Western blot showing Gcm1 and CD44 protein expression in GCSCs transduced with a control (V-Control) or pri-miR-9 (V-miR-9) lentivirus. (right panel) GFAP (green) and TuJ1 (red) immunoreactivity in GCSCs after exposure to miR-9 mimic (100μM) or an oligonucleotide control. (D) BrdU proliferation assay illustrating GCSC proliferation after exposure to miR-9 mimic (100μM) or an oligonucleotide control (P = 0.04, unpaired t-test).

References

    1. DeAngelis LM. Brain tumors. N Engl J Med. 2001;344:114–23. - PubMed
    1. Behin A, Hoang-Xuan K, Carpentier AF, Delattre JY. Primary brain tumours in adults. Lancet. 2003;361:323–31. - PubMed
    1. Chin L, Gray JW. Translating insights from the cancer genome into clinical practice. Nature. 2008;452:553–63. - PMC - PubMed
    1. Verhaak RG, Hoadley KA, Purdom E, et al. Integrated genomic analysis identifies clinically relevant subtypes of glioblastoma characterized by abnormalities in PDGFRA, IDH1, EGFR, and NF1. Cancer Cell. 2010;17:98–110. - PMC - PubMed
    1. Phillips HS, Kharbanda S, Chen R, et al. Molecular subclasses of high-grade glioma predict prognosis, delineate a pattern of disease progression, and resemble stages in neurogenesis. Cancer Cell. 2006;9:157–73. - PubMed

Publication types

MeSH terms