. 2011 Mar 22;108(12):5021-6.
doi: 10.1073/pnas.1016140108. Epub 2011 Mar 8.

Transcriptional and posttranslational up-regulation of HER3 (ErbB3) compensates for inhibition of the HER2 tyrosine kinase

Affiliations

Transcriptional and posttranslational up-regulation of HER3 (ErbB3) compensates for inhibition of the HER2 tyrosine kinase

Joan T Garrett et al. Proc Natl Acad Sci U S A. .

Abstract

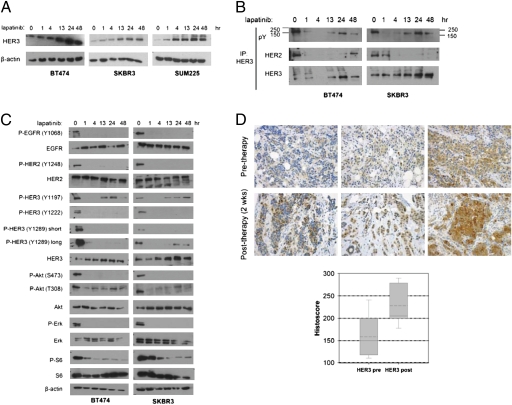
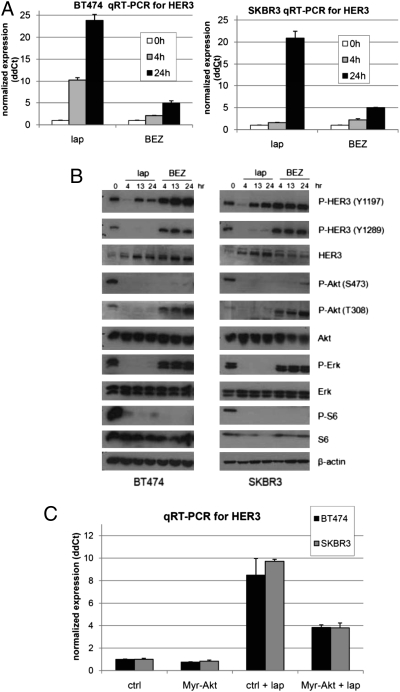
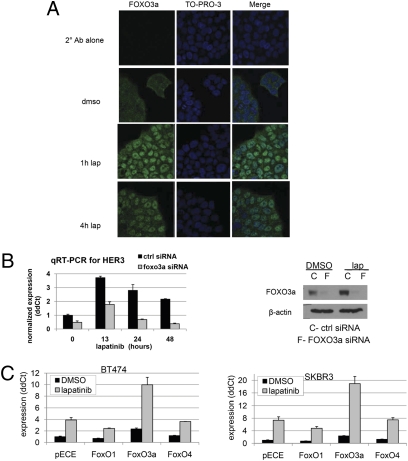
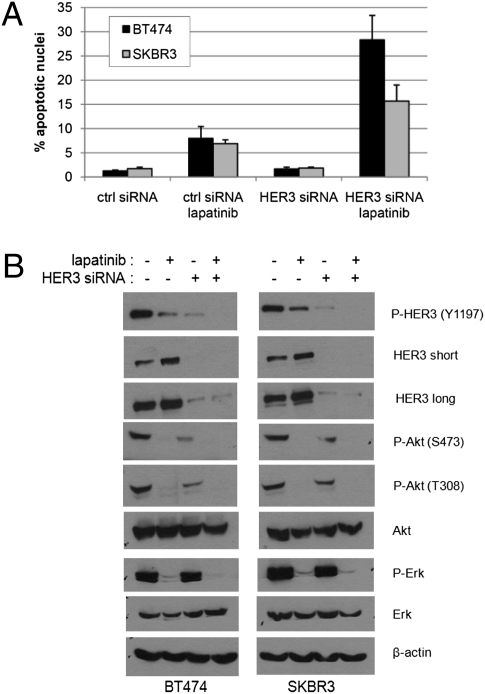
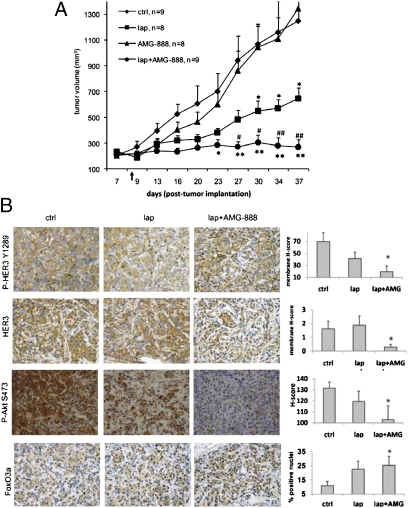
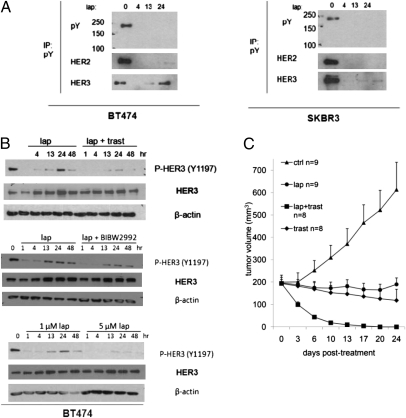
Sustained and complete inhibition of HER3 and its output to PI3K/Akt are required for the optimal antitumor effect of therapeutic inhibitors of the HER2 oncogene. Here, we show that, after inhibition of the HER2 tyrosine kinase with lapatinib, there is PI3K/Akt and FoxO3a-dependent up-regulation of HER3 mRNA and protein. Up-regulated HER3 was then phosphorylated by residual HER2 activity, thus partially maintaining P-Akt and limiting the antitumor action of lapatinib. Inhibition of HER3 with siRNA or a neutralizing HER3 antibody sensitized HER2+ breast cancer cells and xenografts to lapatinib both in vitro and in vivo. Combined blockade of HER2 and HER3 inhibited pharmacodynamic biomarkers of PI3K/Akt activity more effectively than each inhibitor alone. These results suggest that because of HER3-mediated compensation, current clinical inhibitors of HER2 and PI3K/Akt will not block the PI3K pathway completely. They also suggest that therapeutic inhibitors of HER3 should be used in combination with HER2 inhibitors and PI3K pathway inhibitors in patients with HER2- and PI3K-dependent cancers.


Conflict of interest statement

The authors declare no conflict of interest.

Figures

Fig. 1.
Fig. 1.
Inhibition of HER2 results in feedback up-regulation of active HER3 and downstream signaling. (A) BT474, SKBR3, and SUM225 cells were treated with 1 μM lapatinib for the times indicated. Lapatinib and medium were replenished at 24 h. Whole cell lysates were prepared as described in Materials and Methods and separated in a 7% SDS gel, followed by immunoblot with the indicated antibodies. (B) Lysates from BT474 and SKBR3 cells treated with lapatinib for 1–48 h were precipitated with a HER3 antibody followed by immunoblot with P-Tyr, HER2, and HER3 antibodies. Molecular masses (in kDa) are indicated to the left of the P-Tyr immunoblot. (C) The same cell lysates from B were subjected to SDS/PAGE followed by immunoblot with the indicated antibodies. (D) Representative matched pre- and posttherapy sections of formalin-fixed core biopsies from HER2+ tumors treated for 2 wk with lapatinib and subjected to HER3 IHC. Box plots showing the expression at baseline and after 2 wk of treatment in paired tumor samples (n = 8) from a tissue microarray. Boxes indicate 90% of values. Dashed lines indicate mean values, and solid lines indicate median value. External lines indicate the complete range. Increased HER3 staining (P = 0.038) was observed in the posttreatment tumor sections compared with the pretreatment tumor sections.
Fig. 2.
Fig. 2.
Inhibition of HER2 and PI3K/Akt up-regulates HER3 transcription. (A) BT474 and SKBR3 cells were treated with lapatinib or BEZ235 over a time course. Total RNA was extracted and subjected to real-time qPCR for HER3 as described in Materials and Methods. Data were normalized to untreated cells. (B) Cells were treated with lapatinib or BEZ235 for the indicated times. Whole cell lysates were prepared and separated by 7% SDS/PAGE, followed by immunoblot with the indicated antibodies. (C) Cells were transiently transfected with a vector encoding myristoylated Akt (Myr-Akt) or an empty vector (ctrl) overnight followed by the addition of DMSO or lapatinib. After 24 h, cells were harvested, and HER3 RNA was quantitated by qPCR as indicated in Materials and Methods. Each bar represents the mean ± SEM of normalized HER3 expression for each treatment group (n = 3). y axis scale indicates ΔΔCT.
Fig. 3.
Fig. 3.
Increased nuclear FoxO3a upon inhibition of HER2 modulates HER3 RNA. (A) Immunofluorescence showing enhanced nuclear FOXO3a in lapatinib-treated BT474 cells. (B Left) BT474 cells were transfected with siRNA oligonucleotides targeting FoxO3a or a control sequence (ctrl siRNA). The next day, the cells were changed to medium with lapatinib or medium alone. Fresh medium and lapatinib were replenished at 24 h. Cells were harvested at the indicated times and RNA extracted and subjected to real-time qPCR for HER3. Data were normalized to control cells. (Right) FoxO3a immunoblot of lysates from BT474 cells 48 h after transfection with control or FoxO3a siRNA and 24 h after the addition of lapatinib or DMSO. (C) BT474 (Left) and SKBR3 (Right) cells were transfected with vectors encoding FoxO3a, FoxO1, FoxO4, or empty vector (pECE) overnight followed by the addition of DMSO or lapatinib for 24 h. Each bar represents the mean ± SEM of normalized HER3 expression for each vector (n = 3). y axis scale is different for both cell lines and indicates ΔΔCT.
Fig. 4.
Fig. 4.
Genetic inhibition of HER3 sensitizes HER2+ tumor cells to lapatinib. (A) BT474 and SKBR3 cells were seeded in six-well plates in 10% FCS and transfected by siRNA oligonucleotides targeting HER3 or a control sequence (ctrl siRNA). The next day, cells were changed to serum-free medium with or without lapatinib. Adherent and floating cells were collected 48 h later and subjected to TUNEL assay as described in Materials and Methods. Each bar represents the mean ± SEM of cells with apoptotic nuclei for each treatment group (n = 3). (B) Immunoblot of lysates from BT474 and SKBR3 cells 2 d after transfection with either control or HER3 siRNA.
Fig. 5.
Fig. 5.
Inhibition of HER3 sensitizes cells to lapatinib in vivo. (A) Athymic mice were injected with BT474 cells and treated with vehicle, lapatinib, AMG-888, or the combination as indicated in Materials and Methods. Treatment was administered for 4 wk. Tumors were measured overtime with calipers. Each data point represents the mean tumor volume ± SEM (n = 8–9). Black arrow indicates start of when treatment. *P < 0.05, **P < 0.01 vs. control, #P < 0.05, ##P < 0.01 vs. lapatinib. (B) IHC analysis of Y1289 P-HER3, total HER3, FoxO3a, and S473 P-Akt in tumor sections. (Left) Representative images from control tumors, lapatinib-treated tumors, and lapatinib-and-AMG-888-treated tumors. (Right) Quantitative comparison of membrane histoscore (P-HER3 and HER3), histoscore (P-Akt), or percent FoxO3a-positive nuclei. *P ≤ 0.05 compared with control by Student t test.
Fig. 6.
Fig. 6.
Recovery of P-HER3 is dependent on HER2. (A) BT474 and SKBR3 cells were treated with lapatinib for the times indicated. Cell lysates were precipitated with a P-Tyr antibody followed by P-Tyr, HER2, and HER3 immunoblot. Molecular weights are indicated to the left of P-Tyr immunoblot. (B) Cells were treated with lapatinib ± trastuzumab or BIBW2992. (Lower) 1 and 5 μM lapatinib were compared side-by-side over 1–48 h. Drugs and fresh medium were replenished every 24 h. Whole cell lysates were subjected to immunoblot analysis with Y1197 P-HER3, HER3, and β-actin antibodies. (C) Athymic mice were injected with BT474 cells treated with vehicle, lapatinib, trastuzumab, or the combination as indicated in Methods. Treatment was administered for 24 d. Each data point represents the mean tumor volume ± SEM (n = 8–9).

References

    1. Ross JS, Fletcher JA. The HER-2/neu oncogene in breast cancer: Prognostic factor, predictive factor, and target for therapy. Stem Cells. 1998;16:413–428. - PubMed
    1. Slamon DJ, et al. Human breast cancer: Correlation of relapse and survival with amplification of the HER-2/neu oncogene. Science. 1987;235:177–182. - PubMed
    1. Alimandi M, et al. Cooperative signaling of ErbB3 and ErbB2 in neoplastic transformation and human mammary carcinomas. Oncogene. 1995;10:1813–1821. - PubMed
    1. Sierke SL, Cheng K, Kim HH, Koland JG. Biochemical characterization of the protein tyrosine kinase homology domain of the ErbB3 (HER3) receptor protein. Biochem J. 1997;322:757–763. - PMC - PubMed
    1. Hellyer NJ, Cheng K, Koland JG. ErbB3 (HER3) interaction with the p85 regulatory subunit of phosphoinositide 3-kinase. Biochem J. 1998;333:757–763. - PMC - PubMed

Publication types

MeSH terms