

Continuous 24-h nicotinic acid infusion in rats causes FFA rebound and insulin resistance by altering gene expression and basal lipolysis in adipose tissue
- PMID: 21386057
- PMCID: PMC3118587
- DOI: 10.1152/ajpendo.00650.2010
Continuous 24-h nicotinic acid infusion in rats causes FFA rebound and insulin resistance by altering gene expression and basal lipolysis in adipose tissue
Abstract
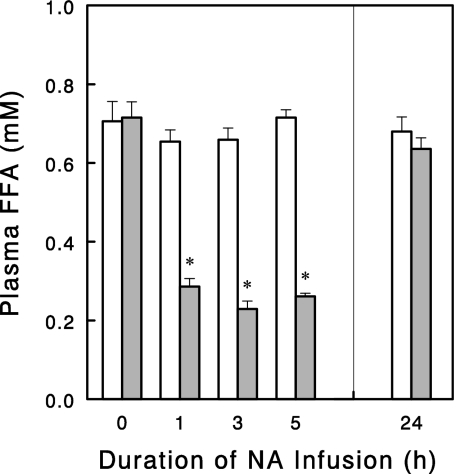
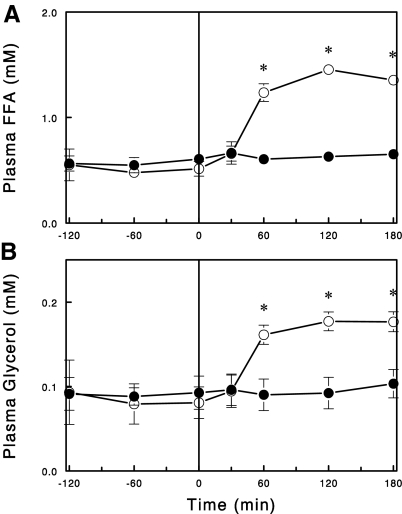
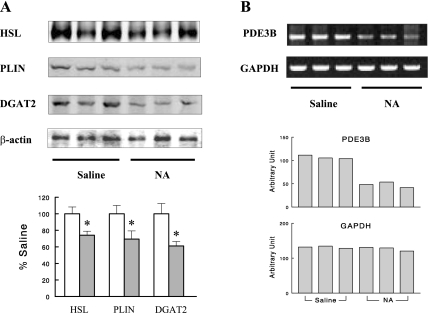
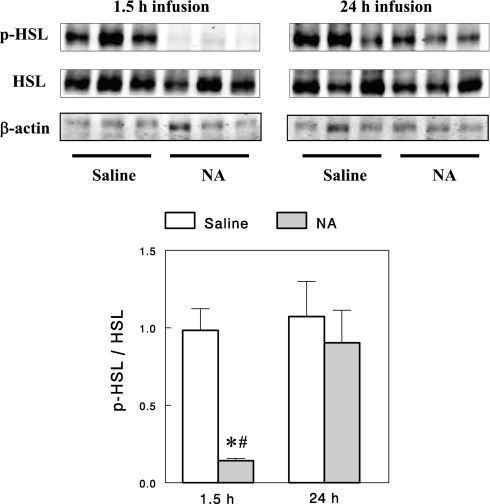
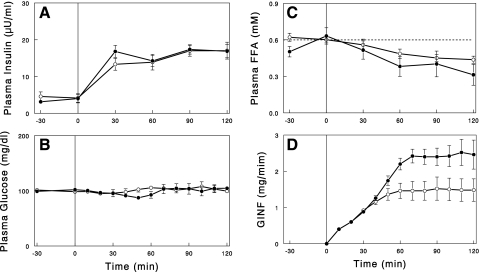
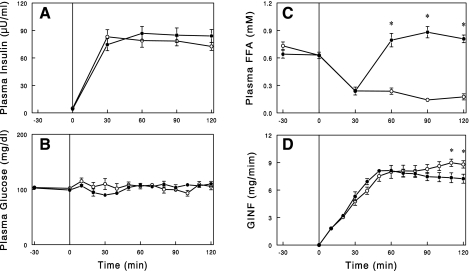
Nicotinic acid (NA) has been used as a lipid drug for five decades. The lipid-lowering effects of NA are attributed to its ability to suppress lipolysis in adipocytes and lower plasma FFA levels. However, plasma FFA levels often rebound during NA treatment, offsetting some of the lipid-lowering effects of NA and/or causing insulin resistance, but the underlying mechanisms are unclear. The present study was designed to determine whether a prolonged, continuous NA infusion in rats produces a FFA rebound and/or insulin resistance. NA infusion rapidly lowered plasma FFA levels (>60%, P < 0.01), and this effect was maintained for ≥5 h. However, when this infusion was extended to 24 h, plasma FFA levels rebounded to the levels of saline-infused control rats. This was not due to a downregulation of NA action, because when the NA infusion was stopped, plasma FFA levels rapidly increased more than twofold (P < 0.01), indicating that basal lipolysis was increased. Microarray analysis revealed many changes in gene expression in adipose tissue, which would contribute to the increase in basal lipolysis. In particular, phosphodiesterase-3B gene expression decreased significantly, which would increase cAMP levels and thus lipolysis. Hyperinsulinemic glucose clamps showed that insulin's action on glucose metabolism was improved during 24-h NA infusion but became impaired with increased plasma FFA levels after cessation of NA infusion. In conclusion, a 24-h continuous NA infusion in rats resulted in an FFA rebound, which appeared to be due to altered gene expression and increased basal lipolysis in adipose tissue. In addition, our data support a previous suggestion that insulin resistance develops as a result of FFA rebound during NA treatment. Thus, the present study provides an animal model and potential molecular mechanisms of FFA rebound and insulin resistance, observed in clinical studies with chronic NA treatment.
Figures
References
-
- Alvarsson M, Grill V. Impact of nicotinic acid treatment on insulin secretion and insulin sensitivity in low and high insulin responders. Scand J Clin Lab Invest 56: 563–570, 1996 - PubMed
-
- Anthony NM, Gaidhu MP, Ceddia RB. Regulation of visceral and subcutaneous adipocyte lipolysis by acute AICAR-induced AMPK activation. Obesity 17: 1312–1317, 2009 - PubMed
-
- Bergman RN, Ader M. Free fatty acids and pathogenesis of type 2 diabetes mellitus. Trends Endocrinol Metab 11: 351–356, 2000 - PubMed
Publication types
MeSH terms
Substances
Grants and funding
LinkOut - more resources
Full Text Sources
Medical
Research Materials