

A bivariate genome-wide approach to metabolic syndrome: STAMPEED consortium
- PMID: 21386085
- PMCID: PMC3064107
- DOI: 10.2337/db10-1011
A bivariate genome-wide approach to metabolic syndrome: STAMPEED consortium
Abstract
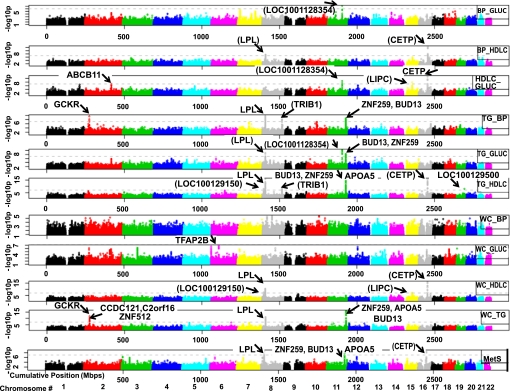
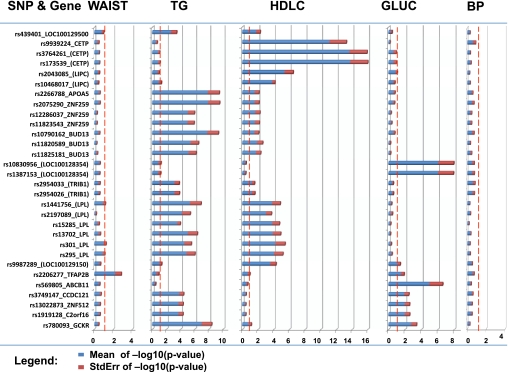
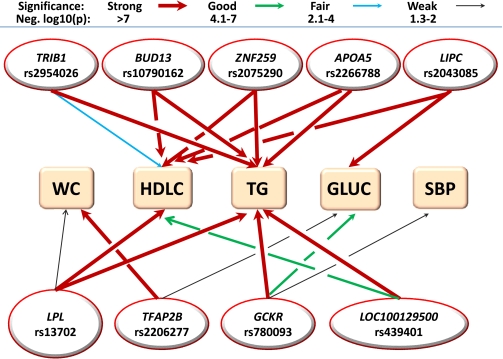
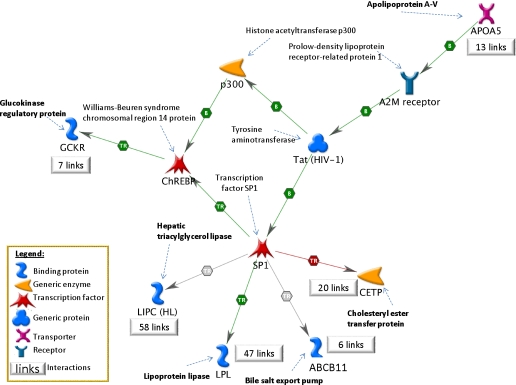
OBJECTIVE The metabolic syndrome (MetS) is defined as concomitant disorders of lipid and glucose metabolism, central obesity, and high blood pressure, with an increased risk of type 2 diabetes and cardiovascular disease. This study tests whether common genetic variants with pleiotropic effects account for some of the correlated architecture among five metabolic phenotypes that define MetS. RESEARCH DESIGN AND METHODS Seven studies of the STAMPEED consortium, comprising 22,161 participants of European ancestry, underwent genome-wide association analyses of metabolic traits using a panel of ∼2.5 million imputed single nucleotide polymorphisms (SNPs). Phenotypes were defined by the National Cholesterol Education Program (NCEP) criteria for MetS in pairwise combinations. Individuals exceeding the NCEP thresholds for both traits of a pair were considered affected. RESULTS Twenty-nine common variants were associated with MetS or a pair of traits. Variants in the genes LPL, CETP, APOA5 (and its cluster), GCKR (and its cluster), LIPC, TRIB1, LOC100128354/MTNR1B, ABCB11, and LOC100129150 were further tested for their association with individual qualitative and quantitative traits. None of the 16 top SNPs (one per gene) associated simultaneously with more than two individual traits. Of them 11 variants showed nominal associations with MetS per se. The effects of 16 top SNPs on the quantitative traits were relatively small, together explaining from ∼9% of the variance in triglycerides, 5.8% of high-density lipoprotein cholesterol, 3.6% of fasting glucose, and 1.4% of systolic blood pressure. CONCLUSIONS Qualitative and quantitative pleiotropic tests on pairs of traits indicate that a small portion of the covariation in these traits can be explained by the reported common genetic variants.
Figures
References
-
- Third report of the National Cholesterol Education Program (NCEP) expert panel on detection, evaluation and treatment of high blood cholesterol in adults (Adult Treatment Panel III). Final report. Circulation 2002;106:3144–3421 - PubMed
-
- Ford ES, Giles WH, Dietz WH. Prevalence of the metabolic syndrome among US adults: findings from the third National Health and Nutrition Examination Survey. JAMA 2002;287:356–359 - PubMed
-
- Ilanne-Parikka P, Eriksson JG, Lindström J, et al. Finnish Diabetes Prevention Study Group Prevalence of the metabolic syndrome and its components: findings from a Finnish general population sample and the Diabetes Prevention Study cohort. Diabetes Care 2004;27:2135–2140 - PubMed
-
- Iribarren C, Go AS, Husson G, et al. Metabolic syndrome and early-onset coronary artery disease: is the whole greater than its parts? J Am Coll Cardiol 2006;48:1800–1807 - PubMed
-
- Kraja AT, Province MA, Huang P, et al. Trends in metabolic syndrome and gene networks in human and rodent models. Endocr Metab Immune Disord Drug Targets 2008;8:198–207 - PubMed
Publication types
MeSH terms
Grants and funding
- 5R01-HL-087679-02/HL/NHLBI NIH HHS/United States
- R01-HL-086694/HL/NHLBI NIH HHS/United States
- U01 HG004402/HG/NHGRI NIH HHS/United States
- N01-HC-85086/HC/NHLBI NIH HHS/United States
- M01RR00425/RR/NCRR NIH HHS/United States
- RL1 MH083268/MH/NIMH NIH HHS/United States
- N01-HC-85084/HC/NHLBI NIH HHS/United States
- N01 HC055016/HL/NHLBI NIH HHS/United States
- R01 MH063706/MH/NIMH NIH HHS/United States
- HL-087660/HL/NHLBI NIH HHS/United States
- R01 HL087698/HL/NHLBI NIH HHS/United States
- N01 HC055019/HL/NHLBI NIH HHS/United States
- R01 HL087647/HL/NHLBI NIH HHS/United States
- N01-HC-85085/HC/NHLBI NIH HHS/United States
- 5R01-HL-087698/HL/NHLBI NIH HHS/United States
- UL1 RR025005/RR/NCRR NIH HHS/United States
- 1RL1-MH-083268-01/MH/NIMH NIH HHS/United States
- U01 HL080295/HL/NHLBI NIH HHS/United States
- R01 HL087679/HL/NHLBI NIH HHS/United States
- N01-HC-55022/HC/NHLBI NIH HHS/United States
- N01-HC-85081/HC/NHLBI NIH HHS/United States
- R01 HL059367/HL/NHLBI NIH HHS/United States
- R01 HL087660/HL/NHLBI NIH HHS/United States
- N01 HC055021/HL/NHLBI NIH HHS/United States
- U01-HL-075572/HL/NHLBI NIH HHS/United States
- R01-HL-087641/HL/NHLBI NIH HHS/United States
- N01 HC015103/HC/NHLBI NIH HHS/United States
- N01 HC085086/HL/NHLBI NIH HHS/United States
- N01-HC-55016/HC/NHLBI NIH HHS/United States
- 5R01-MH-63706:0/MH/NIMH NIH HHS/United States
- R01 HL086694/HL/NHLBI NIH HHS/United States
- U01 HL075572/HL/NHLBI NIH HHS/United States
- U01-HL-080295/HL/NHLBI NIH HHS/United States
- HL-087700/HL/NHLBI NIH HHS/United States
- N01 HC055015/HL/NHLBI NIH HHS/United States
- R01-HL-087652/HL/NHLBI NIH HHS/United States
- 1RL1MH083268-01/MH/NIMH NIH HHS/United States
- R01 HL087652/HL/NHLBI NIH HHS/United States
- U01HG004402/HG/NHGRI NIH HHS/United States
- L1-RR-025005/RR/NCRR NIH HHS/United States
- N01 HC055020/HL/NHLBI NIH HHS/United States
- N01-HC-85082/HC/NHLBI NIH HHS/United States
- R01-HL-59367/HL/NHLBI NIH HHS/United States
- P30 DK063491/DK/NIDDK NIH HHS/United States
- N01-HC-55019/HC/NHLBI NIH HHS/United States
- N01-HC-55015/HC/NHLBI NIH HHS/United States
- N01 HC055222/HL/NHLBI NIH HHS/United States
- HL-0877700/HL/NHLBI NIH HHS/United States
- N01-HC-55222/HC/NHLBI NIH HHS/United States
- N01 HC085079/HL/NHLBI NIH HHS/United States
- N01-HC-85083/HC/NHLBI NIH HHS/United States
- N01-HC-55020/HC/NHLBI NIH HHS/United States
- N01-HC-85080/HC/NHLBI NIH HHS/United States
- 090532/WT_/Wellcome Trust/United Kingdom
- N01-HC-75150/HC/NHLBI NIH HHS/United States
- NC01-HC-55021/HC/NHLBI NIH HHS/United States
- N01 HC055018/HL/NHLBI NIH HHS/United States
- M01 RR000425/RR/NCRR NIH HHS/United States
- N01-HC-85079/HC/NHLBI NIH HHS/United States
- N01 HC055022/HL/NHLBI NIH HHS/United States
- N01 HC075150/HL/NHLBI NIH HHS/United States
- R01 HL087641/HL/NHLBI NIH HHS/United States
- DK-063491/DK/NIDDK NIH HHS/United States
- N01-HC-55018/HC/NHLBI NIH HHS/United States
- HL-087652/HL/NHLBI NIH HHS/United States
- N01 HC045133/HC/NHLBI NIH HHS/United States
- R01 HL087700/HL/NHLBI NIH HHS/United States
- 5R01-HL-087647/HL/NHLBI NIH HHS/United States
- N01 HC035129/HC/NHLBI NIH HHS/United States
LinkOut - more resources
Full Text Sources
Other Literature Sources
Medical
Molecular Biology Databases
Miscellaneous
