. 2010 May 19;22(19):194120.
doi: 10.1088/0953-8984/22/19/194120. Epub 2010 Apr 26.

A simple indentation device for measuring micrometer-scale tissue stiffness

Affiliations

A simple indentation device for measuring micrometer-scale tissue stiffness

I Levental et al. J Phys Condens Matter. .

Abstract

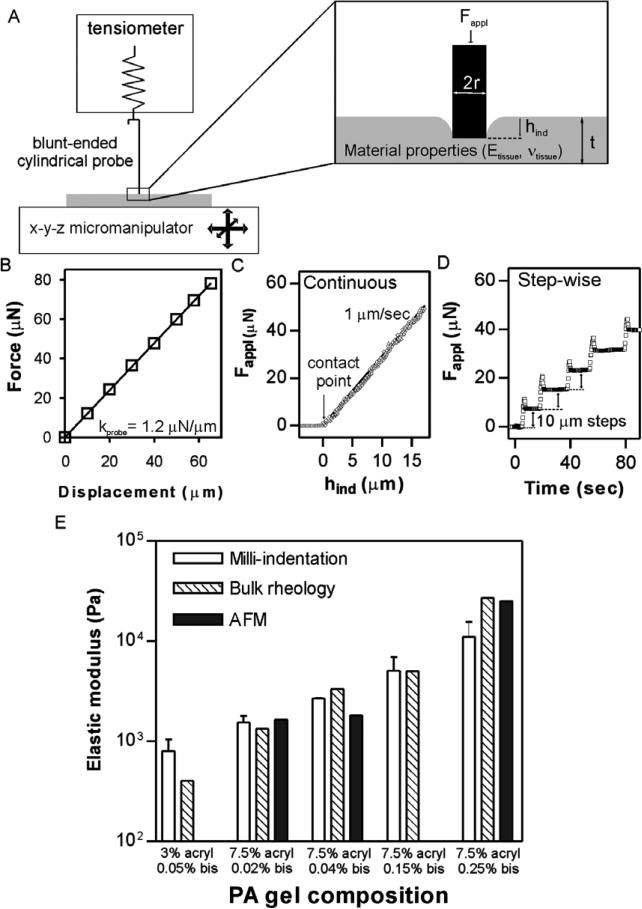
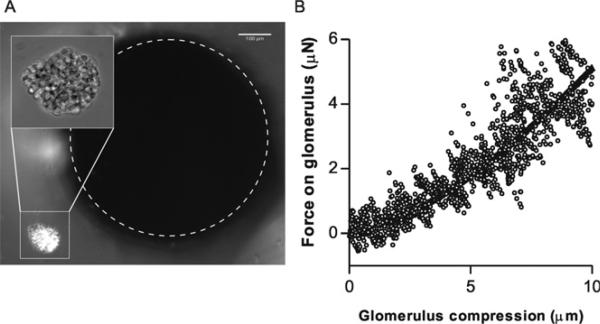
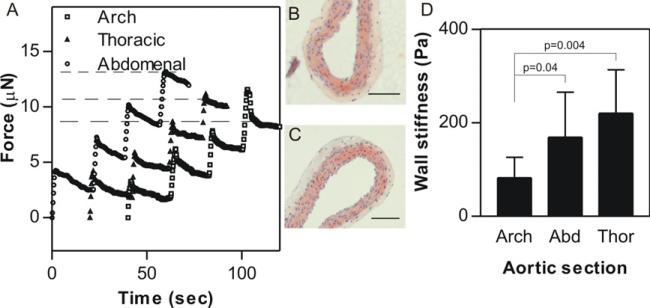
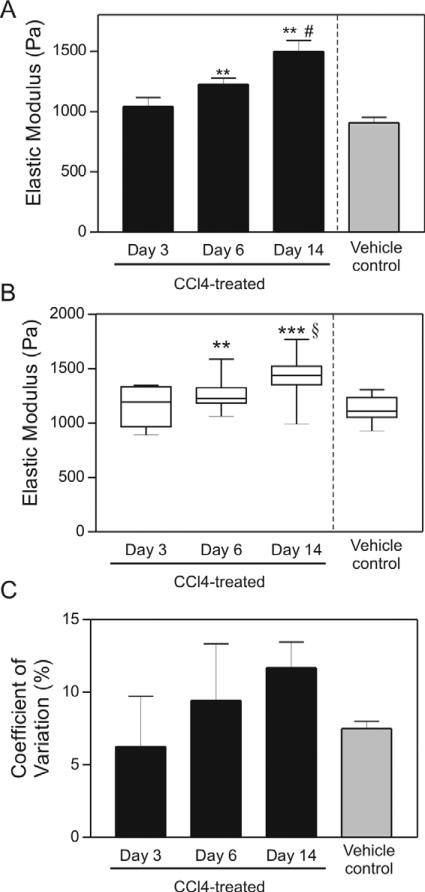
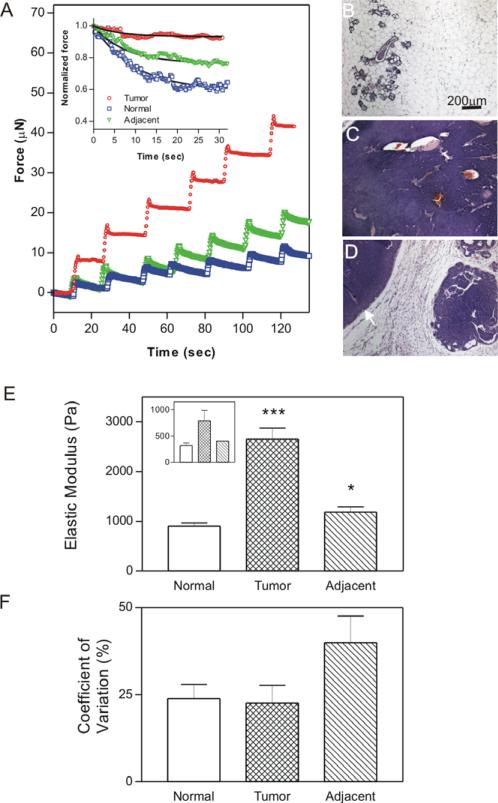
Mechanical properties of cells and extracellular matrices are critical determinants of function in contexts including oncogenic transformation, neuronal synapse formation, hepatic fibrosis and stem cell differentiation. The size and heterogeneity of biological specimens and the importance of measuring their mechanical properties under conditions that resemble their environments in vivo present a challenge for quantitative measurement. Centimeter-scale tissue samples can be measured by commercial instruments, whereas properties at the subcellular (nm) scale are accessible by atomic force microscopy, optical trapping, or magnetic bead microrheometry; however many tissues are heterogeneous on a length scale between micrometers and millimeters which is not accessible to most current instrumentation. The device described here combines two commercially available technologies, a micronewton resolution force probe and a micromanipulator for probing soft biological samples at sub-millimeter spatial resolution. Several applications of the device are described. These include the first measurement of the stiffness of an intact, isolated mouse glomerulus, quantification of the inner wall stiffness of healthy and diseased mouse aortas, and evaluation of the lateral heterogeneity in the stiffness of mouse mammary glands and rat livers with correlation of this heterogeneity with malignant or fibrotic pathology as evaluated by histology.


Figures

Figure 1
Figure 1
Method description and validation. (A) Schematic representation of the stiffness measurement device with a zoom on the region of interface with the sample. (B) A sample calibration of the probe spring constant (kprobe). (C) An example of stiffness measurement of a 7.5% acrylamide/0.02% bis polyacrylamide gel by continuous indentation at 1 μm s–1. The bold line is a fit to equations (3) with E = 2162 Pa. (D) An example of step-wise stiffness measurement of the same gel with successive 10 μm displacements of the gel upwards into the probe. (E) Comparison of measured stiffnesses of PA gels between the indentation technique described here (white bars), bulk rheological measurements (striped bars; taken from Yeung et al (2005) and Solon et al (2007)), and nanoscopic AFM measurements (solid bars; taken from Solon et al (2007)).
Figure 2
Figure 2
Quantitative compression of microscopic objects. (A) A single isolated mouse glomerulus (imaged at 40× in inset) positioned near the tip of the milli-indenter. (B) Force–compression behavior of a mouse glomerulus compressed at 0.04 μm s–1. Fit is a Hertz model fit (equation (4)—glomerulus is simplified as a 100 μm solid sphere with ν = 0.5) with Gglomerulus=3.0kPa.
Figure 3
Figure 3
Stiffness quantification of very thin tissues. (A) Sample traces from four successive indentations (by 5 μm displacements of the probe into the sample) into explanted mouse aorta sections from various regions of the aorta (circles—abdominal; triangles—descending thoracic; squares—aortic arch). Representative images of transverse sections of a longitudinally dissected thoracic aorta (B) and aortic arch (C) section. The wall thickness calculated from these images (~100 μm) was used to correct for the sample thinness in the stiffness calculation. (D) Aortic wall stiffness as a function of the region of the aorta. Mean ± SD from 7 to 9 samples. There appears to be a clear dependence of aortic wall stiffness on the section tested.
Figure 4
Figure 4
Micrometer-scale variation of normal and fibrotic liver tissue. (A) Average elastic modulus from bulk rheological measurements of liver tissue after treatment with CCl4 or vehicle for indicated time. Data are represented as mean ± SD. These bulk rheometry measurements are a subset of those described in Georges et al (2007) and are shown here for comparison with indentation measurements. (B) Box plot of elastic modulus measurements determined by indentation of tissue from the same livers showing mean values and variance increase with time of CCl4 treatment. (C) Quantification of COV of liver tissue after treatment with CCl4 or vehicle for indicated time. Data are represented as the mean ± SD. ** p ≤ 0.01, *** p ≤ 0.001 comparing 3-day to 6- and 14-day CCl4-treated tissues. # p ≤ 0.01 comparing to vehicle to CCl4-treated tissues. § p ≤ 0.001 comparing to vehicle to CCl4-treated tissues. With the exception of one liver from an oil-injected animal which was measured in three regions, all liver slices were measured in five different regions. Numbers of livers per time point ranged from 2 to 4.
Figure 5
Figure 5
Micrometer-scale variation of mammary gland tissue stiffness in relation to pathology. (A) Sample traces from successive indentations (by 10 μm displacements) into explanted mouse mammary gland tissues from tissues of various histological characterizations (squares—normal; circles—tumor; triangles—tissue directly adjacent to tumor). Inset shows sample stress-relaxation curves with fits to data using equations (5). ((B), (C), (D)) Representative hematoxylin and eosin images of normal (B), tumor (C), and adjacent (D) tissues (arrowhead marks the visible tumor). (E) Average elastic modulus of mammary tissue determined by indentation; mean ± SD of 2–8 measurements for each of a total of 24 mammary glands from 7 mice. Inset shows bulk rheological measurements of the same tissues for comparison. (F) Quantification of coefficient of variation (COV; SD/mean) in the three different tissue types. Data are represented as the mean ± SD COV of at least 6 glands per pathology from at least 5 mice. * p value of ≤ 0.05, *** p value of ≤ 0.001.

References

    1. Boyd NF, Martin LJ, Rommens JM, Paterson AD, Minkin S, Yaffe MJ, Stone J, Hopper JL. Mammographic density: a heritable risk factor for breast cancer. Methods Mol. Biol. 2009;472:343–60. - PubMed
    1. Byfield FJ, Aranda-Espinoza H, Romanenko VG, Rothblat GH, Levitan I. Cholesterol depletion increases membrane stiffness of aortic endothelial cells. 2004;87:3336. - PMC - PubMed
    1. Cheng L, Xia X, Yu W, Scriven LE, Gerberich WW. Flat-punch indentation of viscoelastic material. J. Polym. Sci. B. 1999;38:10–22.
    1. Deuschle J, Enders S, Arzt E. Surface detection in nanoindentation of soft polymers. J. Mater. Res. 2007;22:3107–19.
    1. Discher D, Dong C, Fredberg JJ, Guilak F, Ingber D, Janmey P, Kamm RD, Schmid-Schonbein GW, Weinbaum S. Biomechanics: cell research and applications for the next decade. Ann. Biomed. Eng. 2009a;37:847–59. - PMC - PubMed