. 2011 Feb 28;6(2):e17238.
doi: 10.1371/journal.pone.0017238.

Removing batch effects in analysis of expression microarray data: an evaluation of six batch adjustment methods

Affiliations

Removing batch effects in analysis of expression microarray data: an evaluation of six batch adjustment methods

Chao Chen et al. PLoS One. .

Abstract

The expression microarray is a frequently used approach to study gene expression on a genome-wide scale. However, the data produced by the thousands of microarray studies published annually are confounded by "batch effects," the systematic error introduced when samples are processed in multiple batches. Although batch effects can be reduced by careful experimental design, they cannot be eliminated unless the whole study is done in a single batch. A number of programs are now available to adjust microarray data for batch effects prior to analysis. We systematically evaluated six of these programs using multiple measures of precision, accuracy and overall performance. ComBat, an Empirical Bayes method, outperformed the other five programs by most metrics. We also showed that it is essential to standardize expression data at the probe level when testing for correlation of expression profiles, due to a sizeable probe effect in microarray data that can inflate the correlation among replicates and unrelated samples.


Conflict of interest statement

Competing Interests: The authors have declared that no competing interests exist.

Figures

Figure 1
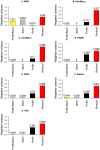
Figure 1. PVCA results in VAS data.
The contribution of each factor to the overall variation was estimated by PVCA. All the effects, including batch effects, Profile effects, interaction between batch and Profile effects, and residuals, were estimated for their contribution to the overall variation. A. Data without batch adjustment. B. Data processed by ComBat_p as batch adjustment tool/model. C. Data processed by ComBat_n. D. Data processed by PAMR. E. Data processed by DWD. F. Data processed by Ratio_G. G. Data processed by SVA.
Figure 2
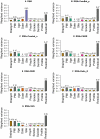
Figure 2. PVCA results in SMRI data.
The contribution of each factor to the overall variation was estimated by PVCA, A. Data without batch adjustment. B. Data preprocessed by RMA with ComBat_n as batch adjustment tool/model. C. Data preprocessed by RMA with ComBat_p. D. Data preprocessed by RMA with PAMR. E. Data preprocessed by RMA with DWD. F. Data preprocessed by RMA with Ratio_G. G. Data preprocessed by RMA with SVA.
Figure 3
Figure 3. Distribution of SMRI ICCs after transformation.
Boxplots of the distribution of z-scores transformed from intraclass correlation coefficients of probe set expression levels between three SMRI technical replicates. The methods are listed along the X axis. The Y axis is the distributions of all probe sets' ICC z-scores. The top of the box represents the top of the third quartile, the bottom of the box represents the bottom of the first quartile, the middle bar is the median value, box whiskers extend to 1.5 times the interquartile range from the box and circles are possible outliers. Δmedian indicates the median difference of z-score distributions between RMA data and data that has been processed with both RMA and the batch-adjustment method. Except for SVA, all batch adjustment methods significantly increased z-scores (p<0.0001).
Figure 4
Figure 4. Correlation between the nominal fold changes and observed fold changes in AAS data.
Correlation between the nominal fold changes and observed fold changes in RMA data and data after batch adjustment programs. We simulated 1200 genes out of 10000 genes as differentially expressed, with log 2 fold change range −1.58, −1.32, −1, −0.58, −0.26, −0.14 and 0.14, 0.26, 0.58, 1, 1.32, 1.58, responding to fold changes that range −3, −2.5, −2, −1.5, −1.2, −1.1 and 1.1,1.2,1.5,2,2.5,3 to reflect the approximate number of differentially expressed genes in the real data. The regression slopes were shown in colors by different program. Correlation coefficients (r2) were shown in legend, separately.
Figure 5
Figure 5. ROC curves in AAS data.
ROC curves are graphical representations of both specificity and sensitivity that take into account both differentially and non-differentially expressed genes. ComBat_p and ComBat_n performed almost identically, so their curves overlap each other almost completely.

References

    1. Brown PO, Botstein D. Exploring the new world of the genome with DNA microarrays. Nature Genetics. 1999;21:33–37. - PubMed
    1. Lockhart DJ, Dong HL, Byrne MC, Follettie MT, Gallo MV, et al. Expression monitoring by hybridization to high-density oligonucleotide arrays. Nature Biotechnology. 1996;14:1675–1680. - PubMed
    1. Schena M, Shalon D, Davis RW, Brown PO. Quantitative Monitoring of Gene-Expression Patterns with a Complementary-DNA Microarray. Science. 1995;270:467–470. - PubMed
    1. Schena M, Shalon D, Heller R, Chai A, Brown PO, et al. Parallel human genome analysis: Microarray-based expression monitoring of 1000 genes. Proceedings of the National Academy of Sciences of the United States of America. 1996;93:10614–10619. - PMC - PubMed
    1. Sims AH. Bioinformatics and breast cancer: what can high-throughput genomic approaches actually tell us? Journal of Clinical Pathology. 2009;62:879–885. - PubMed

Publication types