. 2011 Feb 28;6(2):e17002.
doi: 10.1371/journal.pone.0017002.

On the origin of Tibetans and their genetic basis in adapting high-altitude environments

Affiliations

On the origin of Tibetans and their genetic basis in adapting high-altitude environments

Binbin Wang et al. PLoS One. .

Abstract

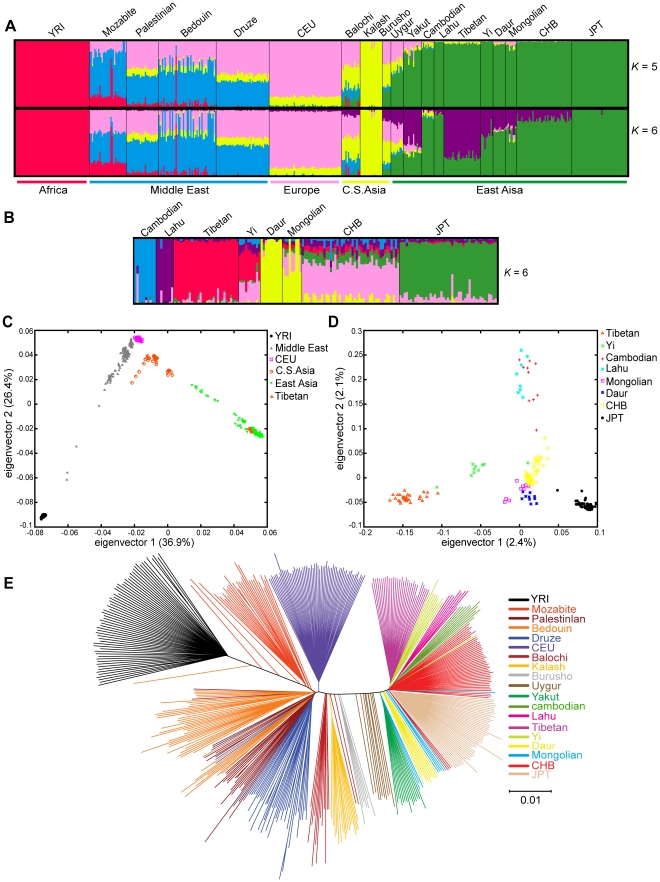
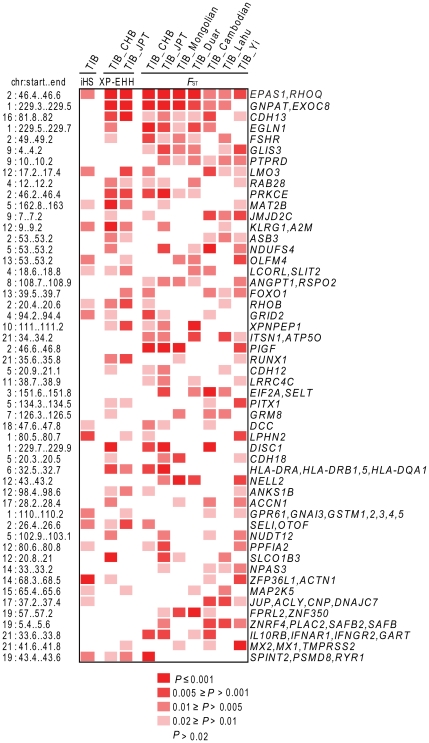
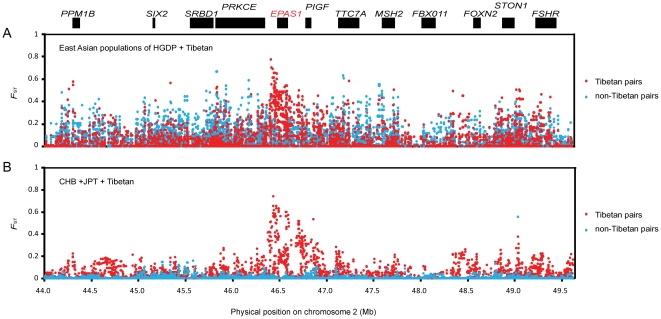
Since their arrival in the Tibetan Plateau during the Neolithic Age, Tibetans have been well-adapted to extreme environmental conditions and possess genetic variation that reflect their living environment and migratory history. To investigate the origin of Tibetans and the genetic basis of adaptation in a rigorous environment, we genotyped 30 Tibetan individuals with more than one million SNP markers. Our findings suggested that Tibetans, together with the Yi people, were descendants of Tibeto-Burmans who diverged from ancient settlers of East Asia. The valleys of the Hengduan Mountain range may be a major migration route. We also identified a set of positively-selected genes that belong to functional classes of the embryonic, female gonad, and blood vessel developments, as well as response to hypoxia. Most of these genes were highly correlated with population-specific and beneficial phenotypes, such as high infant survival rate and the absence of chronic mountain sickness.


Conflict of interest statement

Competing Interests: The authors have declared that no competing interests exist.

Figures

Figure 1
Figure 1. Genetic relationships between population pairs of Tibetan and others.
(A) The ancestry sharing proportion of 497 individuals (from the 19 world-wide populations) inferred with frappe at K = 5 and K = 6, using 165,073 loosely linked autosomal SNPs. Each vertical line represents an individual and is composed of colored segments whose lengths represent the individual's coefficients in K speculated ancestral groups. (B) The ancestry sharing proportion of 167 individuals (from the 8 EA populations) at K = 6, using 165,073 autosomal SNPs. (C, D) Principal component analyses of population structure on the 19 worldwide populations (C) and the 8 East Asian populations (D), using 509,491 autosomal SNPs. (E) Neighbor-joining phylogenic tree of the 497 individuals of 19 world-wide populations, using 165,073 autosomal SNPs. The color of each individual was assign according to their population affiliation. C.S. Asia: South/Central Asia, YRI: Yoruban in Ibadan, CHB: Han Chinese in Beijing, JPT: Japanese in Tokyo.
Figure 2
Figure 2. Significant genomic regions indentified in Tibetans by iHS, XP-EHH, and F ST.
Ten selection tests (one iHS, two XP-EHH, and seven F ST, showed as columns) were performed on Tibetans or Tibetan-included pairs, and empirical P-value of each 200-kb genomic window (showed as row) was obtained. Windows with P≤0.02 are listed, and then sorted according to the numbers of significant appearances. Only windows that appeared at least four times are shown. The physical position of each window on the human genome is labeled on the left of plot. Genes within or near each window are shown on the right. Genes without functional summary provided by RefSeq were removed. The windows with no functional genes are not shown.
Figure 3
Figure 3. Pairwise F ST values of the EPAS1 gene and its surrounding regions.
The plots of locus-by-locus pairwise F ST of East Asian Populations of HGDP (including Yi, Mongolian, Duar, Lahu, and Cambodian) + Tibetan (A), and CHB, JPT, and Tibetan pairs (B) are shown. The x-axis of each plot is the physical position (Mb) on Chromosome 2. The y-axis of each plot is the value of pairwise F ST. Each dot of the plots represents a pairwise F ST of a SNP. The extremely high F ST are mostly located within the EPAS1 gene.

References

    1. Zhang DD, Li SH. Optical dating of Tibetan human hand- and footprints: An implication for the palaeoenvironment of the last glaciation of the Tibetan Plateau. Geophys Res Lett. 2002;29:1072–1074.
    1. Su B, Xiao C, Deka R, Seielstad MT, Kangwanpong D, et al. Y chromosome haplotypes reveal prehistorical migrations to the Himalayas. Hum Genet. 2000;107:582–590. - PubMed
    1. Zhao M, Kong QP, Wang HW, Peng MS, Xie XD, et al. Mitochondrial genome evidence reveals successful Late Paleolithic settlement on the Tibetan Plateau. Proc Natl Acad Sci U S A. 2009;106:21230–21235. - PMC - PubMed
    1. Kang L, Li S, Gupta S, Zhang Y, Liu K, et al. Genetic structures of the Tibetans and the Deng people in the Himalayas viewed from autosomal STRs. J Hum Genet. 2010;55:270–277. - PubMed
    1. Wen B, Xie X, Gao S, Li H, Shi H, et al. Analyses of genetic structure of Tibeto-Burman populations reveals sex-biased admixture in southern Tibeto-Burmans. Am J Hum Genet. 2004;74:856–865. - PMC - PubMed

Publication types