

A spatio-temporal model of Notch signalling in the zebrafish segmentation clock: conditions for synchronised oscillatory dynamics
- PMID: 21386903
- PMCID: PMC3046134
- DOI: 10.1371/journal.pone.0016980
A spatio-temporal model of Notch signalling in the zebrafish segmentation clock: conditions for synchronised oscillatory dynamics
Abstract
In the vertebrate embryo, tissue blocks called somites are laid down in head-to-tail succession, a process known as somitogenesis. Research into somitogenesis has been both experimental and mathematical. For zebrafish, there is experimental evidence for oscillatory gene expression in cells in the presomitic mesoderm (PSM) as well as evidence that Notch signalling synchronises the oscillations in neighbouring PSM cells. A biological mechanism has previously been proposed to explain these phenomena. Here we have converted this mechanism into a mathematical model of partial differential equations in which the nuclear and cytoplasmic diffusion of protein and mRNA molecules is explicitly considered. By performing simulations, we have found ranges of values for the model parameters (such as diffusion and degradation rates) that yield oscillatory dynamics within PSM cells and that enable Notch signalling to synchronise the oscillations in two touching cells. Our model contains a Hill coefficient that measures the co-operativity between two proteins (Her1, Her7) and three genes (her1, her7, deltaC) which they inhibit. This coefficient appears to be bounded below by the requirement for oscillations in individual cells and bounded above by the requirement for synchronisation. Consistent with experimental data and a previous spatially non-explicit mathematical model, we have found that signalling can increase the average level of Her1 protein. Biological pattern formation would be impossible without a certain robustness to variety in cell shape and size; our results possess such robustness. Our spatially-explicit modelling approach, together with new imaging technologies that can measure intracellular protein diffusion rates, is likely to yield significant new insight into somitogenesis and other biological processes.
Conflict of interest statement
Figures

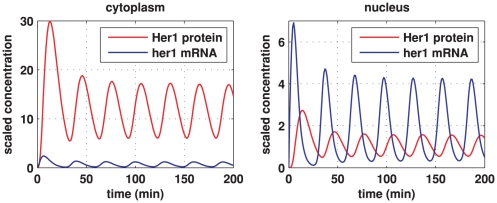
 and the her1 mRNA concentration by
  gives the true concentrations. All parameter values are stated in the Supporting Information. The other species in the core oscillator model show qualitatively similar behaviour.
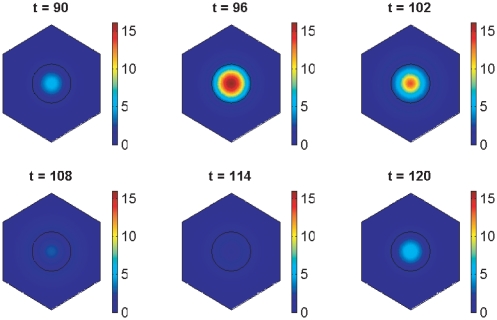
 gives the true concentration). Parameter values are stated in the Supporting Information.
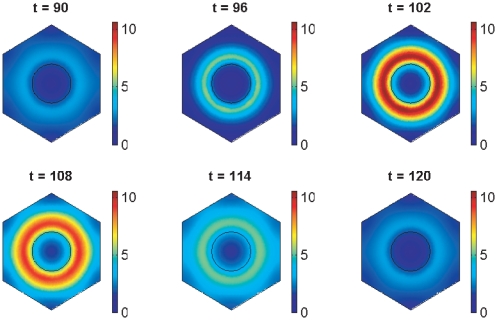
 gives the true concentration). Parameter values are stated in the Supporting Information.
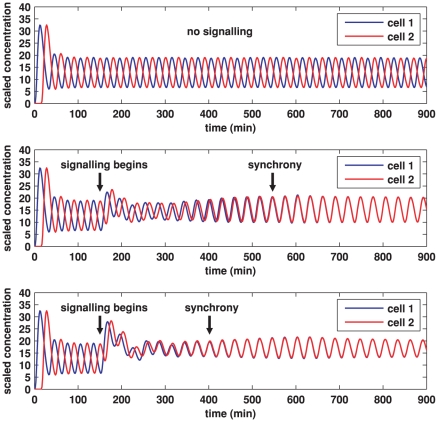
 gives the true concentration). In each plot, transcription begins in cell 1 at time 0 and in cell 2 when half the core oscillator period (15 minutes) has elapsed. All parameter values are stated in the Supporting Information. Top: no signalling. The cells oscillate perfectly out of synchrony. Middle: Notch signalling begins at time 150 minutes. Oscillations in the two cells synchronise by 550 minutes and the average concentration is increased by approximately 20% compared to the case (top plot) in which no signalling occurs. Bottom: Notch signalling begins at time 150 minutes but here we reduce by a factor of 10 (relative to the middle plot) the threshold concentration
  of NICD above which its impact on transcription is stronger. The oscillations synchronise by 400 minutes, the average concentration is further increased, and the amplitude of the oscillations is notably reduced.
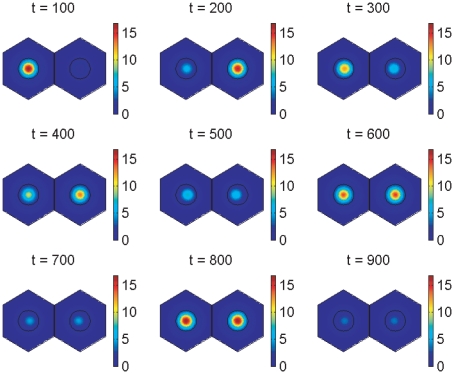
 gives the true concentration). The parameters used to create the middle plot in figure 7 are used here (see Supporting Information). Signalling between the cells begins at 150 minutes and has clearly synchronised their behaviour by 600 minutes.
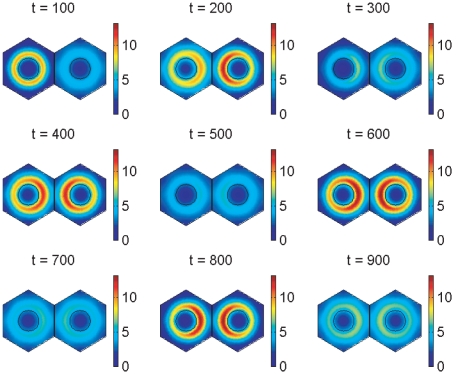
 gives the true concentration). The parameters used to create the middle plot in figure 7 are used here (see Supporting Information). Signalling between the cells begins at 150 minutes and has clearly synchronised their behaviour by 600 minutes.
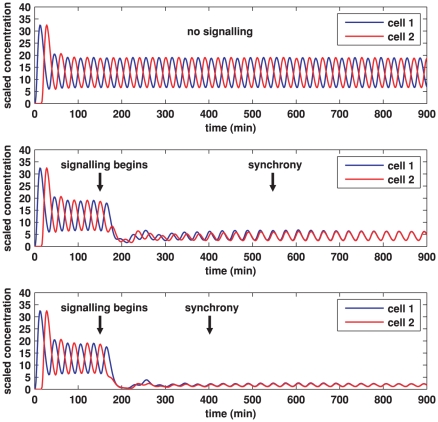
 gives the true concentration). In each plot, transcription begins in cell 1 at time 0 and in cell 2 when half the core oscillator period (15 minutes) has elapsed. All parameter values are stated in the Supporting Information. Top: no signalling. The cells oscillate perfectly out of synchrony. Middle: Notch signalling begins at time 150 minutes. Oscillations in the two cells synchronise by 550 minutes and, compared to the case (top plot) in which no signalling occurs, the average concentration is decreased by a factor of 3 and the amplitude of the oscillations is notably reduced. Bottom: Notch signalling begins at time 150 minutes but here we reduce by a factor of 10 (relative to the middle plot) the threshold concentration
  of NICD above which its impact on transcription is stronger. The oscillations synchronise by 400 minutes, the average concentration is further decreased, and the amplitude of the oscillations is further reduced.
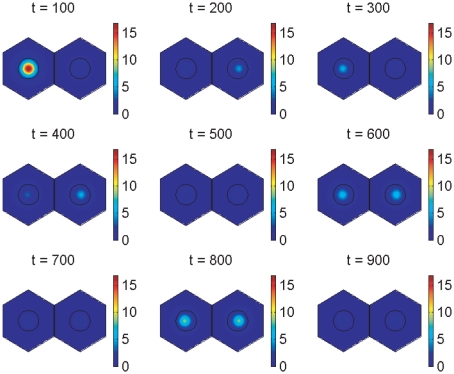
 gives the true concentration). The parameters used to create the middle plot in figures 7 and 10 are used here (see Supporting Information). Signalling between the cells begins at 150 minutes and has synchronised their behaviour by 600 minutes.
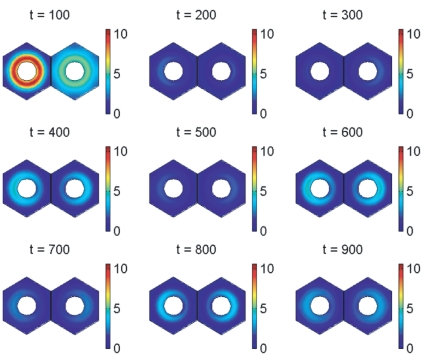
 gives the true concentration). The protein is absent from the nucleus by our modelling assumptions. The parameters used to create the middle plot in figures 7 and 10 are used here (see Supporting Information). Signalling between the cells begins at 150 minutes and has synchronised their behaviour by 600 minutes.
References
-
- Lewis J. Autoinhibition with transcriptional delay: a simple mechanism for the zebrafish somitogenesis oscillator. Current Biology. 2003;13:1398–1408. - PubMed
-
- Gomez C, Ozbudak E, Wunderlich J, Baumann D, Lewis J, et al. Control of segment number in vertebrate embryos. Nature. 2008;454:335–339. - PubMed
Publication types
MeSH terms
Substances
Grants and funding
LinkOut - more resources
Full Text Sources
Molecular Biology Databases
Research Materials
Miscellaneous
