. 2011 Feb 28;6(2):e17021.
doi: 10.1371/journal.pone.0017021.

Segregation of fluorescent membrane lipids into distinct micrometric domains: evidence for phase compartmentation of natural lipids?

Affiliations

Segregation of fluorescent membrane lipids into distinct micrometric domains: evidence for phase compartmentation of natural lipids?

Ludovic D'auria et al. PLoS One. .

Abstract

Background: We recently reported that sphingomyelin (SM) analogs substituted on the alkyl chain by various fluorophores (e.g. BODIPY) readily inserted at trace levels into the plasma membrane of living erythrocytes or CHO cells and spontaneously concentrated into micrometric domains. Despite sharing the same fluorescent ceramide backbone, BODIPY-SM domains segregated from similar domains labelled by BODIPY-D-e-lactosylceramide (D-e-LacCer) and depended on endogenous SM.

Methodology/principal findings: We show here that BODIPY-SM further differed from BODIPY-D-e-LacCer or -glucosylceramide (GlcCer) domains in temperature dependence, propensity to excimer formation, association with a glycosylphosphatidylinositol (GPI)-anchored fluorescent protein reporter, and lateral diffusion by FRAP, thus demonstrating different lipid phases and boundaries. Whereas BODIPY-D-e-LacCer behaved like BODIPY-GlcCer, its artificial stereoisomer, BODIPY-L-t-LacCer, behaved like BODIPY- and NBD-phosphatidylcholine (PC). Surprisingly, these two PC analogs also formed micrometric patches yet preferably at low temperature, did not show excimer, never associated with the GPI reporter and showed major restriction to lateral diffusion when photobleached in large fields. This functional comparison supported a three-phase micrometric compartmentation, of decreasing order: BODIPY-GSLs > -SM > -PC (or artificial L-t-LacCer). Co-existence of three segregated compartments was further supported by double labelling experiments and was confirmed by additive occupancy, up to ∼70% cell surface coverage. Specific alterations of BODIPY-analogs domains by manipulation of corresponding endogenous sphingolipids suggested that distinct fluorescent lipid partition might reflect differential intrinsic propensity of endogenous membrane lipids to form large assemblies.

Conclusions/significance: We conclude that fluorescent membrane lipids spontaneously concentrate into distinct micrometric assemblies. We hypothesize that these might reflect preexisting compartmentation of endogenous PM lipids into non-overlapping domains of differential order: GSLs > SM > PC, resulting into differential self-adhesion of the two former, with exclusion of the latter.


Conflict of interest statement

Competing Interests: The authors have declared that no competing interests exist.

Figures

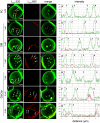
Figure 1
Figure 1. In living erythrocytes, three PC analogs concentrate at similar micrometric patches with similar temperature dependence.
(A) Confocal imaging. Freshly isolated erythrocytes were immobilized onto poly-L-lysine-coated coverslips, labelled with the PC analogs indicated at left, washed and examined upside-down by confocal microscopy (i.e. with the free erythrocyte surface close to the objective) at the temperatures indicated above. Notice rounded areas of strong concentration (brilliant patches) over a weak diffuse labelling. Non-labelled foci with less regular contours (arrowheads) are also visible with all tracers at 37°C (d,h,l) and are best evidenced with NBD-PC (18∶1) at all temperatures (i-l). All scale bars, 2 µm. (B) Relative concentration . Fluorescence enrichment and exclusion are illustrated for NBD-PC (18∶1) by line intensity profiles along the paths indicated by orange lines at panels A, j-l, with background set at zero outside cells (a reference level confirmed by non-labelled foci). Lines are interrupted to better evidence foci of concentration or exclusion. (C) Morphometry: effect of temperature and comparison with SL analogs. Number of patches labelled by BODIPY-PC (closed circles), -SM (open circles) or -GlcCer (open squares) was recorded per hemi-cell surface at the indicated temperatures (means±SEM of 3-7 independent experiments, each with 3–45 cells, except at 10°C for BODIPY-SM and -GlcCer, 1 experiment). Notice the opposite response to temperature increase between BODIPY-PC and -SM vs -GlcCer.
Figure 2
Figure 2. In living erythrocytes, BODIPY-SLs, but not BODIPY-PC, exhibit differential spectral shift at high concentration.
Left, confocal imaging. Freshly isolated erythrocytes were labelled as at Fig. 1, using BODIPY-PC (a), -SM (b-d) or -GlcCer (e-g) at 1 µM (b,e), 2 µM (c,f) or 3 µM (a,d,g), washed and immediately examined by confocal microscopy at 20°C (a-d) or 37°C (e-g). Images were all generated with λexc 488 nm, with simultaneous recording in the green (left; λem 520 nm) and red channels (middle; λem 605 nm), then merged (right). Note that yellow signal in merged images, indicative of ordered clustering (excimers), is essentially absent at 3 µM for BODIPY-PC, weak for -SM and strong for -GlcCer. All scale bars, 2 µm. Right, quantitation of conventional and excimer emission. Intensity profiles were recorded along the paths indicated by the continuous orange lines at left; due to different settings, the minimal baseline values cannot be compared with other figures. Numbers #1-4 refer to the indicated patches. Average red/green emission ratio for BODIPY-SM is <20% at 3 µM (d′), but already >30% for BODIPY-GlcCer at 2 µM (f′).
Figure 3
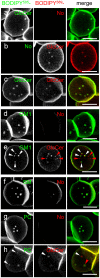
Figure 3. In living erythrocytes, micrometric domains of BODIPY-GlcCer co-localize with -GM1, but not with -PC.
Erythrocytes were labelled either with only one of the indicated BODIPY505-lipids (1.5 µM -GlcCer and -PC; 1.3 µM -GM1; 1 µM -SM [a,g,d,f]), or 4 µM BODIPY589-GlcCer (b); or sequentially labelled with 4 µM BODIPY589-GlcCer then with the indicated BODIPY505-lipids (same concentration as above) in the continued presence of BODIPY589-GlcCer (c,e,h). Images were sequentially recorded in the green (left) and red (middle) channels with settings adjusted to best match signal intensities, then merged (right). Notice that no BODIPY505-lipids produced excimers at the concentrations used, except BODIPY-SM (f) precluding unambiguous testing of co-distribution with BODIPY589-GlcCer. Despite lower intensity and resolution of the red tracer, BODIPY505- and BODIPY589-GlcCer show perfect co-localization (c). At (e), all BODIPY505-GM1 domains also recruit BODIPY589-GlcCer (white arrowheads). Additional spots, only but less intensely labelled by BODIPY589-GlcCer (red arrowheads) reflect the higher number of BODIPY-GlcCer domains, attributed to the higher melting temperature of natural GlcCer than for GM1. In contrast, BODIPY505-PC and BODIPY589-GlcCer mostly segregate (h; white arrowheads; a rare co-localization is indicated by the red arrowhead). All scale bars, 5 µm.
Figure 4
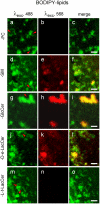
Figure 4. In CHO cells, only BODIPY-D-e-SLs form micrometric patches competent for excimer formation.
CHO cells were surface-labelled at low temperature with 5 µM of the indicated BODIPY-lipids, washed and immediately examined by confocal microscopy at 10°C to prevent endocytosis. Bottom confocal sections are shown. Images were recorded in the green channel (left) at the usual intensity, then in the red channel at 30-times higher laser power (middle) and merged (right). Whereas excimer formation (yellow signal at right) is obvious for BODIPY-SM (f) and BODIPY-GSLs with natural stereochemistry [-GlcCer (i) and -D-e-LacCer (l)], no spectral shift is observed using BODIPY-PC (c) and a GSL with artificial stereochemistry, -L-t-LacCer (o). For the two latter derivatives, notice convoluted wavy labelling, with notches indicated by red arrowheads. All scale bars, 2 µm.
Figure 5
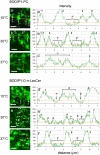
Figure 5. Differential effect of temperature on boundaries of BODIPY-PC and -GSL micrometric domains in CHO cells.
CHO cells were surface-labelled at 4°C with 1 µM BODIPY-PC (a-c) or -D-e-LacCer (d-f), washed and transferred to the indicated temperatures, at which the bottom cell surface was immediately imaged. At left (a-f), confocal imaging. Notice convoluted labelling for BODIPY-PC at 30°C and 37°C, with notches indicated by red arrowheads. All scale bars, 2 µm. At right (a′-f′), quantitation of relative concentrations by line intensity profiles (orange lines at left). Individual, well-defined peaks above fluorescence “baseline” (orange dotted lines at the level of 50 a.u. at right) are numbered from #1 up to 7; clustered patches are indicated by straight brackets; foci below baseline are numbered from #1′ to 2′, and indicated by rounded brackets. Notice that BODIPY-PC concentrates up to 30°C into sharp peaks which vanish at 37°C, whereas BODIPY-D-e-LacCer sharp peaks are best defined at 37°C.
Figure 6
Figure 6. Complementarity between BODIPY-PC, -SM and -GSL domains.
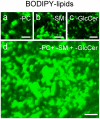
Cells were surface-labelled at 4°C with BODIPY-PC (a,d), -SM (b,d) and -GlcCer (c,d, 1 µM each), either alone (a-c) or combined (d). After washing, the bottom cell surface was immediately imaged by confocal microscopy at 20°C to maximize domain formation for each component. All scale bars, 2 µm. Notice that BODIPY-PC, -SM and -GlcCer patches separately label ∼25% of the CHO cell surface at a-c, whereas simultaneous labelling covers ∼70%.
Figure 7
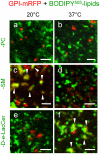
Figure 7. Differential segregation of BODIPY-PC, -SM and -GSL from a GPI-anchored fluorescent reporter on CHO cells.
One day after transfection with an expression vector for the Lo-glycosylphosphatidylinositol-anchored protein reporter, GPI-mRFP (red), CHO cells were transferred to 20°C (left; a,c,e) or 37°C (right; b,d,f), labelled with BODIPY505-PC (a,b), -SM (c,d), or -D-e-LacCer (e,f), washed and immediately analyzed in the green then in red channel. Notice that the GPI-reporter labels micrometric patches (red) showing extensive colocalization with BODIPY-SM at 20°C but not at 37°C, and with BODIPY-D-e-LacCer at 37°C but not at 20°C. For separated (single-channel) imaging with BODIPY505-SM and -D-e-LacCer, see Fig. S5.
Figure 8
Figure 8. BODIPY-PC and -SM enriched micrometric domains show differential sensitivity to endogenous GSL and SM depletion.
CHO cells were either kept untreated (a,e; CTL); selectively depleted for GSLs with the GlcCer synthase inhibitor, D-PDMP (b,f) or sphingomyelin with sphingomyelinase (SMase; c,g); or depleted of both using the upstream, dihydroceramide synthase inhibitor, fumonisin B1 (FB1; d,h), then surface-labelled with BODIPY-PC (a-d) or -SM (e-h), washed and immediately examined by confocal microscopy at 10°C. All images are bottom confocal sections recorded at the same laser power and magnification (scale bars, 2 µm). For each panel, intensity profiles along paths indicated by orange lines on confocal images are shown at right (a′-h′), by reference to baseline homogenous labelling (∼50 a.u.; horizontal dotted lines). Notice in control cells similar well-defined patches for the PC and the SM analogs (a,e) with individual sharp peaks (arrowheads #1-4). Most BODIPY-PC micrometric patches/peaks resist GSL depletion by D-PDMP (b) or SM depletion by SMase (c). In contrast, essentially all well-defined micrometric BODIPY-SM patches vanish upon either D-PDMP (f) or SMase (g). For similar properties between BODIPY-PC and -L-t-LacCer, see Fig. S4.
Figure 9
Figure 9. PC and L-t-LacCer analogs show the most severe restriction to lateral diffusion at 30°C.
CHO cells were surface-labelled with the indicated BODIPY- or NBD-PC analogs (a, BODIPY-PC; b, NBD-PC [16∶0]; c, NBD-PC [18∶1]), or BODIPY-GSL analogs with either a natural stereochemistry (d, -GlcCer; e, -D-e-LacCer) or artificial stereochemistry (f, -L-t-LacCer), rapidly washed and immediately analyzed by FRAP at 30°C in fields of either 20 µm2 (filled symbols) or 5 µm2 (open symbols), using a Bio-Rad confocal microscope. Fluorescence recovery is expressed as percentage of signal before photobleaching, after correction for residual fluorescence immediately after bleaching. Values are means±SEM of 3-to-112 experiments and are fitted to monoexponential functions. Data for BODIPY-D-e-LacCer are reproduced from , for comparison purposes. Notice that lateral diffusion of PC analogs and BODIPY-L-t-LacCer is restricted when analyzed in large fields as compared with small fields (a-c; f), contrasting with undistinguishable mobility of D-e-GSL analogs in the two field sizes (d,e).
Figure 10
Figure 10. BODIPY-PC lateral diffusion in large fields is selectively restricted at 30°C but largely relaxed at 37°C.
CHO cells were surface-labelled with BODIPY-PC (a), -SM (b) or -D-e-LacCer (c), rapidly washed and analyzed by FRAP immediately after transfer to 30°C or 37°C, in either 20-µm2 (filled bars) or 5-µm2 fields (open bars), using the Zeiss LSM510 confocal microscope. Mobile fractions are means±SEM of 4-to-32 experiments. N.S., not significant; **, p<0.01.
Figure 11
Figure 11. Restriction to BODIPY-PC large-scale lateral diffusion at 30°C depends on both endogenous GSLs and SM.
CHO cells were either kept untreated (open bars); or treated with D-PDMP (ascending striped bar), SMase (descending striped bar) or FB1 (filled bar). For efficiency of depletion, see Table S1. Cells were then surface-labelled with BODIPY-PC, washed and rapidly transferred to 30°C for immediate FRAP analysis in 20- µm2 fields using the Bio-Rad confocal microscope. Mobile fractions are means±SEM of 3-to-16 experiments. **, p<0.01; ***, p<0.001.

Similar articles

Cited by

References

    1. Singer SJ, Nicolson GL. The fluid mosaic model of the structure of cell membranes. Science. 1972;175:720–731. - PubMed
    1. van Meer G, Voelker DR, Feigenson GW. Membrane lipids: where they are and how they behave. Nat Rev Mol Cell Biol. 2008;9:112–124. - PMC - PubMed
    1. Singh RD, Liu Y, Wheatley CL, Holicky EL, Makino A, et al. Caveolar endocytosis and microdomain association of a glycosphingolipid analog is dependent on its sphingosine stereochemistry. J Biol Chem. 2006;281:30660–30668. - PubMed
    1. Brown DA, London E. Functions of lipid rafts in biological membranes. Annu Rev Cell Dev Biol. 1998;14:111–136. - PubMed
    1. Simons K, Ikonen E. Functional rafts in cell membranes. Nature. 1997;387:569–572. - PubMed

Publication types

MeSH terms