. 2011 Feb 28;6(2):e17458.
doi: 10.1371/journal.pone.0017458.

The Populus Class III HD ZIP transcription factor POPCORONA affects cell differentiation during secondary growth of woody stems

Affiliations

The Populus Class III HD ZIP transcription factor POPCORONA affects cell differentiation during secondary growth of woody stems

Juan Du et al. PLoS One. .

Abstract

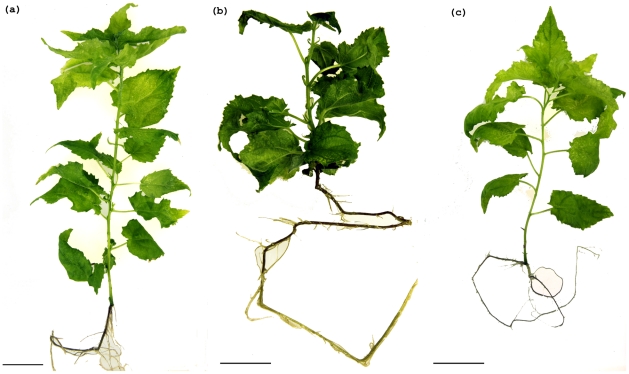
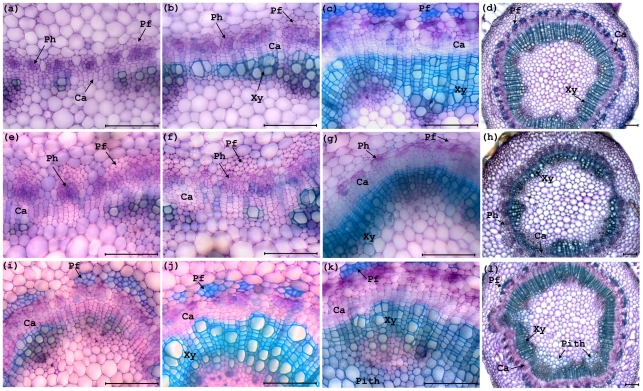
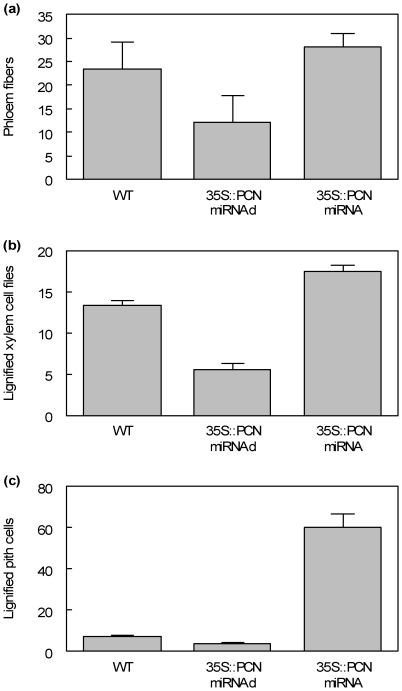
The developmental mechanisms regulating cell differentiation and patterning during the secondary growth of woody tissues are poorly understood. Class III HD ZIP transcription factors are evolutionarily ancient and play fundamental roles in various aspects of plant development. Here we investigate the role of a Class III HD ZIP transcription factor, POPCORONA, during secondary growth of woody stems. Transgenic Populus (poplar) trees expressing either a miRNA-resistant POPCORONA or a synthetic miRNA targeting POPCORONA were used to infer function of POPCORONA during secondary growth. Whole plant, histological, and gene expression changes were compared for transgenic and wild-type control plants. Synthetic miRNA knock down of POPCORONA results in abnormal lignification in cells of the pith, while overexpression of a miRNA-resistant POPCORONA results in delayed lignification of xylem and phloem fibers during secondary growth. POPCORONA misexpression also results in coordinated changes in expression of genes within a previously described transcriptional network regulating cell differentiation and cell wall biosynthesis, and hormone-related genes associated with fiber differentiation. POPCORONA illustrates another function of Class III HD ZIPs: regulating cell differentiation during secondary growth.


Conflict of interest statement

Competing Interests: The authors have declared that no competing interests exist.

Figures

Figure 1
Figure 1. Phylogenetic relationships among Class III HD ZIP gene family in land plants determined using maximum parsimony analysis.
Bootstrap support values above 50% are presented above branches and Bayesian support values above 0.50 are presented below branches, where * indicates maximum 1.00 support. Black squares indicate major duplication events, while the empty square represents evidence of a duplication event without bootstrap support. Major clades are presented by longitudinal lines to the right of the tree, where solid lines represent fully supported monophyletic clades (PHB, C8, and CNA) and dashed lines indicate clade supported by Bayesian, but not bootstrap support. Black triangles represent where the AtHB8, AlHB8, MgHB7 clade is supported according to Bayesian analysis. Species abbreviations: At, Arabidopsis thaliana; Bd, Brachypodium distachyon; Al, Arabidopsis lyrata; Cp, Carica papaya; Cs, Cucumis sativus; Gm, Glycine max; Me, Manihot esculenta; Mt, Medicago truncatula; Mg, Mimulus guttatus; Os, Oryzas sativa; Pt, Populus trichocarpa; Pp, Physcomitrella patens; Rc, Ricinus communis; Sm, Selanginella moellendorffii, Sb, Sorghum bicolor; Vv, Vitis vinifera; Zm, Zea mays.
Figure 2
Figure 2. Expression of PCN (Fig. 2a) and PCN paralog Pt-ATHB.11 (Fig. 2b) in organs, as assayed by Quantitative Real Time PCR.
Relative expression of PCN and paralog Pt-ATHB.11 in apices, leaves, roots, and stem was determined using Quantitative Real Time PCR (QRT-PCR) of two month old tissue culture grown Populus tremula x alba. PCN and paralog Pt-ATHB.11 are expressed in all tissues assayed, and are highly expressed in shoot apexes and stem tissue with active cambium. Stem tissue samples were confirmed to have a vascular cambium by phloroglucinol staining of secondary xylem. Relative expression (Mean ± SE) was calculated from triplicate QRT-PCR reactions of independent RNA samples prepared from different trees.
Figure 3
Figure 3. Expression of PCN during Populus stem development revealed by whole mount in situ hybridization.
Antisense PCN (first and second columns), sense negative control (third column), and positive control (fourth column) probes were hybridized to stem sections from two month old tissue culture grown trees. (a) Section from first elongating internode hybridized with antisense PCN probe. PCN is expressed broadly during primary growth, with strongest expression associated with procambium. (b) Higher magnification of first elongating internode hybridized with antisense PCN probe. (c) Section from first elongating internode hybridized with sense PCN probe (negative control), showing minimal background hybridization. (d) Section from first elongating internode hybridized with antisense pop50S probe (positive control). (e) Section from the fourth internode, hybridized with antisense PCN probe. PCN is expressed broadly in the cambial zone, and strongly in differentiating xylem. (f) Higher magnification of (e). (g) Section from the fourth internode hybridized with negative control sense PCN probe. (h) Section from fourth internode hybridized with positive control antisense pop50S probe. (i) Section from seventh internode hybridized with antisense PCN probe. PCN expression is mostly associated with differentiating xylem cells and lightly in cambial zone. (j) Higher magnification of (i). (k) Section from seventh internode hybridized with sense PCN probe (negative control). (l) Section from seventh internode hybridized with positive control antisense pop50S probe. (m) Section from the base internode hybridized with antisense PCN probe. PCN expression is largely limited to the differentiating xylem cells and cambial zone. (n) Higher magnification of (m). (o) Section from the base internode hybridized with sense PCN probe (negative control). (p) Section from the base internode hybridized with positive control antisense pop50S probe. Cambial zone (Ca), Phloem fiber (Pf), Procambium (Pc), Ray (r), Xylem (Xy), Bar = 100 µm.
Figure 4
Figure 4. PCN expression levels in PCN 35S::PCN-miRNAd gain of function and 35S::miRNA-PCN knockdown transgenic plants relative to wild-type controls.
PCN expression levels were detected by Quantitative Real Time PCR (Materials and Methods). Relative expression levels (mean ± SE) were calculated from triplicate qRT-PCR reactions of independent RNA samples for each transgenic and the wild-type prepared from different batches of two month-old plants. T test (P<0.05) comparison showed significant differences of expression in all transgenics compared to the wild-types. (a) Comparison PCN transcripts in wild-type and 35S::PCN-miRNAd gain of function plants. (b) Comparison PCN transcripts in wild-type and 35S::miRNA-PCN plants.
Figure 5
Figure 5. Phenotypes of PCN 35S::PCN-miRNAd gain of function and 35S::miRNA-PCN knockdown plants compared to wild-type controls.
(a) Wild-type plants (2 months old). (b) PCN 35S::PCN-miRNAd gain of function (2 months old) plants have changes to plant architecture, shorter plants length, darker green color in leaf. (c) 35S::miRNA-PCN knockdown plants (2 month old) have no strong differences from the wild-type. Bar = 2.5cm.
Figure 6
Figure 6. Transverse sections of stems from two month old wild-type and 35S::PCN-miRNAd gain of function and 35S::miRNA-PCN knockdown Populus.
(a) Section from fourth internode of wild-type Populus stem during primary growth. (b) Section from seventh internode of wild-type Populus stem during transition to secondary growth, showing secondary xylem tissue formation. (c) Section from bottom internode of wild-type Populus stem showing secondary phloem fibers and secondary xylem tissue. (d) Lower magnification view of bottom internode of wild-type stem. (e) Section from fourth internode of 35S::PCN-miRNAd gain of function Populus stem during primary growth, showing increased cambium cell layers. (f) Section from seventh internode of 35S::PCN-miRNAd gain of function Populus stem during transition to secondary growth, showing delayed secondary xylem formation. (g) Section from bottom internode of 35S::PCN-miRNAd gain of function Populus stem showing no lignified phloem fibers formation and decreased xylem tissue. (h) Lower magnification of section from bottom internode of 35S::PCN-miRNAd gain of function Populus stem showing no lignified phloem fibers formation and decreased xylem tissue. (i) Section from fourth internode of 35S::miRNA-PCN knockdown Populus stem showing early formed lignified phloem fibers and xylem cells by comparing with the wild-type. (j) Section from seventh internode of 35S::miRNA-PCN knockdown Populus stem showing increased secondary phloem fibers and xylem tissue formation by comparing with the wild-type. (k) Section from bottom internode of 35S::miRNA-PCN knockdown Populus stem showing ectopic lignifications in pith cells. (l) Lower magnification of section from bottom internode of 35S::miRNA-PCN knockdown Populus stem showing ectopic lignifications in pith cells. Cambial zone (Ca), Phloem (Ph), Phloem fiber (Pf), Xylem (Xy), Bar = 100 µm.
Figure 7
Figure 7. Quantification of phenotypes in bottom internode of 35S::PCN-miRNAd gain of function and 35S::miRNA-PCN knockdown transgenics.
(a) Comparison of number of phloem fibers in the bottom internodes of wild-type, 35S::PCN-miRNAd gain of function and 35S::miRNA-PCN. (b) Comparison of number of lignified xylem cell layers in the bottom internodes of wild-type, 35S::PCN-miRNAd gain of function and 35S::miRNA-PCN. (c) Comparison of number of lignified pith cells in the bottom internodes of wild-type, 35S::PCN-miRNAd gain of function and 35S::miRNA-PCN. Relative expression levels (mean ± SE) were calculated from three cross-sections of the bottom internodes of three independent wild type plants, three miRNAd gain of function transgenics, three 35S::PCN-miRNAd transgenics prepared from different batches of two month-old plants.

Similar articles

Cited by

References

    1. Groover A, Nieminen K, Helariutta Y, Mansfield SD. Wood formation in Populus. 2010. in, Genetics and Genomics of Populus Jansson, Bhalerao, and Groover (eds) Springer.
    1. Larson PR. The Vascular Cambium. 1994. Springer-Verlag.
    1. Groover AT. What genes make a tree a tree? Trends in Plant Science. 2005;10:210–214. - PubMed
    1. Spicer R, Groover A. The evolution of development of the vascular cambium and secondary growth. New Phytol. 2010;186:577–592. - PubMed
    1. Schrader J, Nilsson J, Mellerowicz E, Berglund A, Nilsson P, et al. A high-resolution transcript profile across the wood-forming meristem of poplar identifies potential regulators of cambial stem cell identity. Plant Cell. 2004;16:2278–2292. - PMC - PubMed

Publication types

MeSH terms