. 2011 Feb 28;6(2):e17393.
doi: 10.1371/journal.pone.0017393.

Biogenic volatile organic compound and respiratory CO2 emissions after 13C-labeling: online tracing of C translocation dynamics in poplar plants

Affiliations

Biogenic volatile organic compound and respiratory CO2 emissions after 13C-labeling: online tracing of C translocation dynamics in poplar plants

Andrea Ghirardo et al. PLoS One. .

Abstract

Background: Globally plants are the primary sink of atmospheric CO(2), but are also the major contributor of a large spectrum of atmospheric reactive hydrocarbons such as terpenes (e.g. isoprene) and other biogenic volatile organic compounds (BVOC). The prediction of plant carbon (C) uptake and atmospheric oxidation capacity are crucial to define the trajectory and consequences of global environmental changes. To achieve this, the biosynthesis of BVOC and the dynamics of C allocation and translocation in both plants and ecosystems are important.

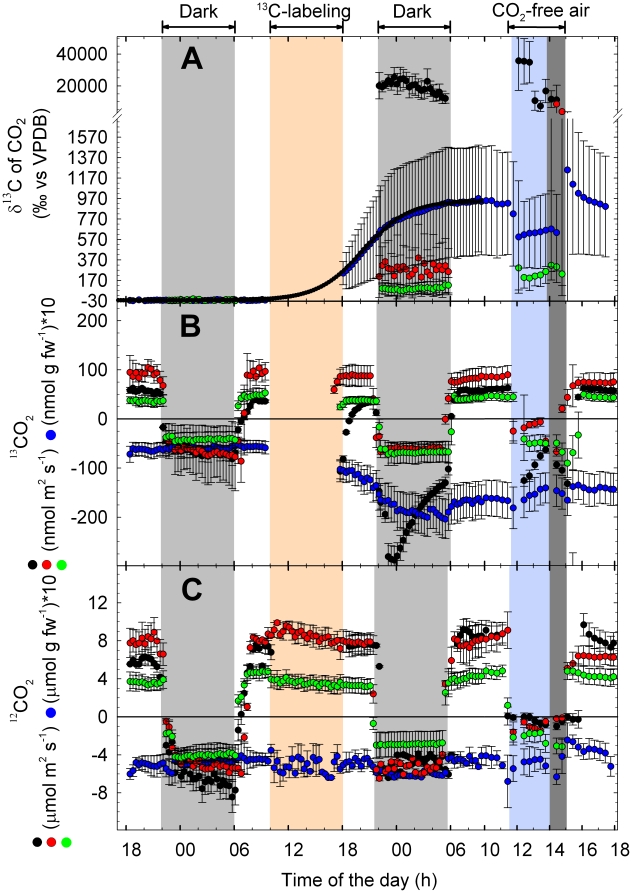
Methodology: We combined tunable diode laser absorption spectrometry (TDLAS) and proton transfer reaction mass spectrometry (PTR-MS) for studying isoprene biosynthesis and following C fluxes within grey poplar (Populus x canescens) saplings. This was achieved by feeding either (13)CO(2) to leaves or (13)C-glucose to shoots via xylem uptake. The translocation of (13)CO(2) from the source to other plant parts could be traced by (13)C-labeled isoprene and respiratory (13)CO(2) emission.

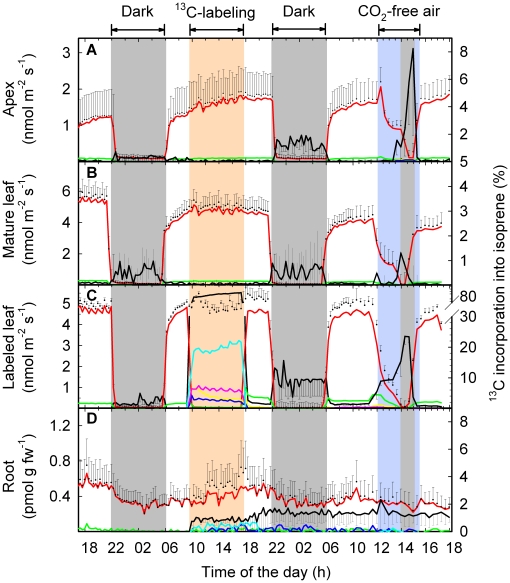
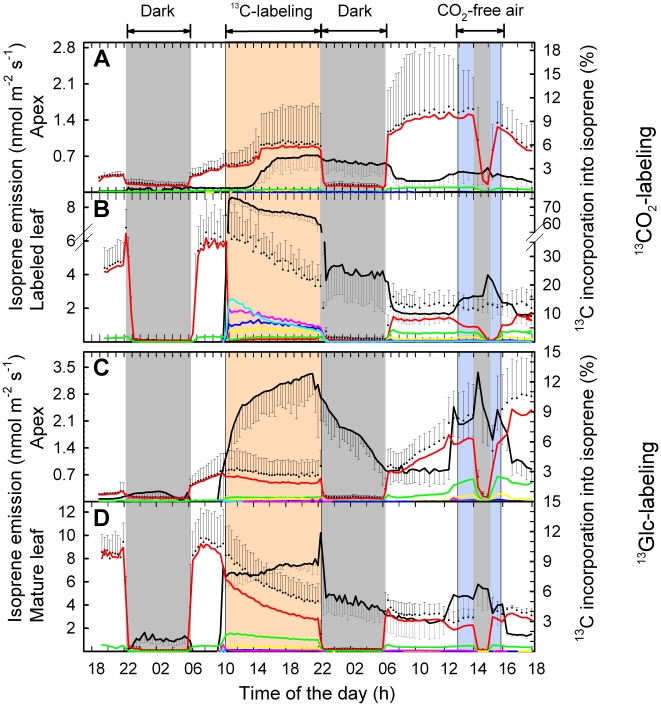
Principal finding: In intact plants, assimilated (13)CO(2) was rapidly translocated via the phloem to the roots within 1 hour, with an average phloem transport velocity of 20.3±2.5 cm h(-1). (13)C label was stored in the roots and partially reallocated to the plants' apical part one day after labeling, particularly in the absence of photosynthesis. The daily C loss as BVOC ranged between 1.6% in mature leaves and 7.0% in young leaves. Non-isoprene BVOC accounted under light conditions for half of the BVOC C loss in young leaves and one-third in mature leaves. The C loss as isoprene originated mainly (76-78%) from recently fixed CO(2), to a minor extent from xylem-transported sugars (7-11%) and from photosynthetic intermediates with slower turnover rates (8-11%).

Conclusion: We quantified the plants' C loss as respiratory CO(2) and BVOC emissions, allowing in tandem with metabolic analysis to deepen our understanding of ecosystem C flux.


Conflict of interest statement

Competing Interests: The authors have declared that no competing interests exist.

Figures

Figure 1
Figure 1. Scheme of the experimental design.
Ten liter per minute of synthetic VOC-free air (BASI Schöberl, Germany) were mixed with CO2 (38,000 ppmv) to a final concentration (in the cuvette) of 385 ppmv, passing a 20 L equilibration tank before being completely humidified by bubbling the airstream through pure, distilled water. A dew point unit assured a stable humidity level before the airflow entered each of the four cuvettes through flow controllers, set at 2 L min−1. One cuvette (# 1) could be connected via a 3-port valve to a separate 13CO2-tank for 13C-labeling. The gas was purchased already mixed at 385 ppmv 13CO2 and humidified separately using a portable dew point generator (Li-610, Licor, Lincoln, NE, USA). Another cuvette (# 4) was connected to a VOC standard mixture for the calibration of the PTR-MS. Inlet and outlet of the cuvettes were directed sequentially via electronic, computer controlled 3-port valves to the three gas analyzers (LI-7000, Licor; or GFS-3000, Heinz Walz, Germany; TDLAS; PTR-MS), while the excess flow was directed to a vent which was periodically checked for flow rate in order to ensure that the whole system was gas-tight. The grey boxes display the two different experimental designs: either with intact plant placed into hydroponic solution where one single mature leaf was labeled with 13CO2 or with two parallel shoots labeled either with 13CO2 or 13Glc.
Figure 2
Figure 2. Net assimilation and respiratory CO2 emissions of intact poplar plants upon 13CO2 feeding.
(A) Calculated δ13C of respired CO2 in the absence of net CO2 assimilation, assimilation rate of (B) 13CO2 and (C) 12CO2 of the mature 13CO2-fumigated leaf (black symbols), a younger fully expanded leaf (red), the apical bud with enclosed young leaves (green) of intact plants. (B) Release of CO2 from root systems immersed in hydroponic solution (blue). Calculated respiratory δ13C of roots during the period of 13CO2 labeling could not be presented (see Materials and Methods), they were replaced instead by sigmoidal fitted data (SigmaPlot v9.0, CA, USA; equation “sigmoid, 3 parameters”; R2 = 0.9997) shown in black. The labeling period is shown in orange, the period of stress (absence of CO2) by a blue background, and the dark periods are marked grey. Note that the stress period and the last dark period overlap. Data represent the mean of 3 experiments ± s.e.
Figure 3
Figure 3. Analysis of δ13C in bulk material of poplar.
(A) Intact plants labeled with 13CO2, (B) shoots labeled with 13CO2, and (C) shoots fed with 13Glc. Data represent the mean of 3 experiments ± s.e.
Figure 4
Figure 4. Calculated fluxes of 13C-labeled sugars into the nutrient solutions of detached poplar shoots.
13C enrichment (black circles) and fluxes (open triangles) of sugars into (positive values) and out of (negative) the nutrient solution of shoots labeled with 13CO2. The dark phase is indicated with dark grey color. Data represent the mean of 3 experiments ± s.e.
Figure 5
Figure 5. Net assimilation and respiratory CO2 emissions of detached poplar shoots upon 13CO2 and 13C-glucose feeding.
(A, D) Calculated δ13C of respired CO2 in the absence of net CO2 assimilation, assimilation rate of (B, E) 13CO2 and (C, F) 12CO2 in apical buds (red and blue symbols) and mature leaves (black and green symbols) from shoots labeled with (A, B) 13CO2 or (C, D) 13Glc. The labeling period is shown in orange, stress (absence of CO2) condition is indicated by a blue background, and dark conditions are marked grey. Note that the stress period and the last dark period overlap. Data represent the mean of 3 experiments ± s.e.
Figure 6
Figure 6. Isoprene emission of intact poplar plants and incorporation of label of upon 13CO2 feeding.
Total isoprene emission (black symbols), its 13C incorporation (black line) and isotopic composition (m74, light blue; m73, magenta; m72, dark blue; m71, yellow; m70, green; m69, red) from (A) the apex, (B) a fully expanded leaf, (C) 13CO2-labeled mature leaf, (D) and the root system of intact plants. The labeling period is shown in orange, stress (absence of CO2) is indicated by a blue background, and dark conditions are marked in grey. Details of the experimental phases can be found in the Materials and Methods section. Data represent the mean of 3 experiments ± s.e. (omitted for isotopic composition).
Figure 7
Figure 7. Isoprene emission of detached poplar shoots and 13C incorporation upon 13CO2 and 13C-glucose feeding.
Total isoprene emission (black symbols), its 13C incorporation (black line) and isotopic composition (m74, light blue; m73, magenta; m72, dark blue; m71, yellow; m70, green; m69, red) in (A, C) apical buds and (B, D) mature leaves from shoots labeled with (A, B) 13CO2 or (C, D) 13Glc. The labeling period is shown in orange, stress (absence of CO2) is indicated by a blue background, and dark conditions are marked in grey. Details of the experimental phases can be found in the Materials and Methods section. Data represent the mean of three experiments ± s.e. (omitted for isotopic composition).
Figure 8
Figure 8. Isotopic composition of isoprene molecules and the corresponding 13C-incorporation during 13C-labeling of intact poplar plants and detached shoots.
Pattern of isoprene isotopologues (m74, light blue; m73, magenta; m72, dark blue; m71, yellow; m70, green; m69, white) and 13C-incorporation (open circles) in (A) intact plants, (B) shoots labeled with 13CO2, and (C) shoots labeled with 13Glc. Panels (D), (E), and (F) show the isotopic composition of isoprene emitted by the same plants during the period with CO2-free air. Details of the experimental phases can be found in the Materials and Methods section. Data represent the mean of 3 experiments ± s.e.
Figure 9
Figure 9. Concentration of the isoprene precursor DMADP and incorporation of 13C in DMADP molecules in different plant parts of intact poplar plants and detached shoots.
DMADP content (grey bars) and 13C-incorporation into DMADP (black bars) in (A) apex, mature leaf, labeled leaf and root of intact plants labeled with 13CO2, in (B) apex and leaves of shoots labeled with 13CO2, and in (C) labeled with 13Glc. Leaf DMADP content and relative 13C-abundance (% of 13C in total DMADP carbon) was assayed as described by Ghirardo et al. . Data represent the mean of 3 experiments ± s.d. (n.s.: no significant 13C-enrichment).
Figure 10
Figure 10. Tissue specific emission rates of BVOC from poplar plants.
Summary of (A) methanol, (B) ethanol, (C) LOX products, (D) acetaldehyde, (E) isoprene, (F) monoterpene, (G) total quantity of C loss as BVOC, average emissions during night (dark grey bars) and light (light grey bars) from (A) apex, (M) mature leaves younger than (L) labeled leaves, (R) root system in intact plants. The daily percentage of C loss (H) as BVOC related to daily net assimilation was calculated during day 2 (excluded for R). Data represent the mean of 3 experiments ± s.e. (n.d.  =  not detectable). Statistical significant differences (t-test with p<0.05) of emissions between A, M, L and R are given with different minuscule or capital letters for dark or light emissions, respectively.

References

    1. Prentice IC, Farquhar GD, Fasham MJR, Goulden ML, Heimann M, et al. The carbon cycle and atmospheric carbon dioxide. In: Houghton JT, Ding Y, Griggs DJ, Noguer M, van der Linden PJ, et al., editors. Climate Change 2001: The Physical Science Basis. Contribution of Working Group I to the Third Assessment Report of the Intergovernmental Panel on Climate Change. Cambridge and New York, NY, UKUSA: Cambridge University Press; 2001. pp. 183–238.
    1. Forster P, Ramaswamy V, Artaxo P, Berntsen T, Betts R, et al. Changes in atmospheric constituents and in radiative forcing. In: Solomon S, Qin D, Manning M, Chen Z, Marquis M, et al., editors. Climate Change. Vol. 2007. CambridgeNew York, NY, United KingdomUSA: The Physical Science Basis. Contribution of Working Group I to the Fourth Assessment Report of the Intergovernmental Panel on Climate Change. Cambridge University Press; 2007. pp. 129–234.
    1. Trainer M, Hsie E, McKeen S, Tallamraju R, Parrish D, et al. Impact of natural hydrocarbons on hydroxyl and peroxy radicals at a remote site. J Geophys Res. 1987;92:11879–11894.
    1. Chameides WL, Lindsay RW, Richardson J, Kiang CS. The role of biogenic hydrocarbons in urban photochemical smog: Atlanta as a case study. Science. 1988;241:1473–1475. - PubMed
    1. Jacob DJ, Wofsy SC. Photochemistry of biogenic emissions over the Amazon Forest. J Geophys Res-Atmos. 1988;93:1477–1486.

Publication types

MeSH terms