. 2011 Feb 28;6(2):e17299.
doi: 10.1371/journal.pone.0017299.

Lipid pathway alterations in Parkinson's disease primary visual cortex

Affiliations

Lipid pathway alterations in Parkinson's disease primary visual cortex

Danni Cheng et al. PLoS One. .

Abstract

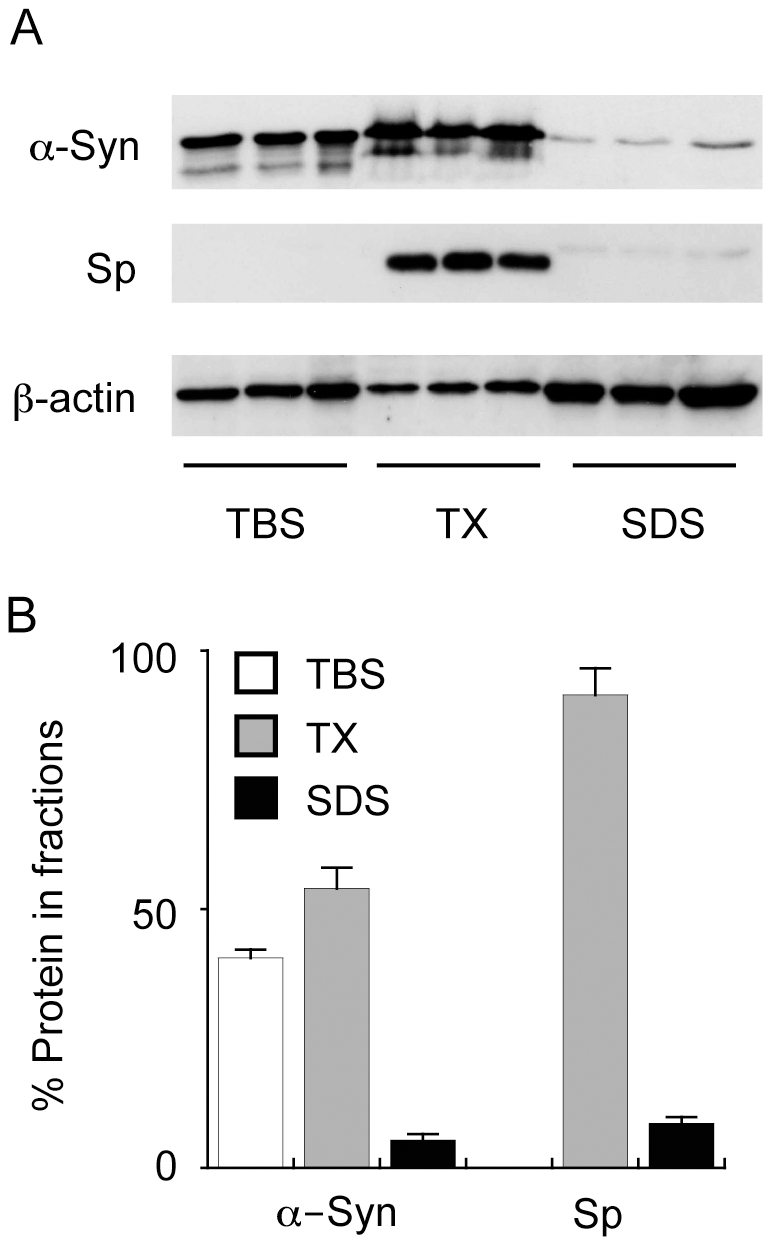
Background: We present a lipidomics analysis of human Parkinson's disease tissues. We have focused on the primary visual cortex, a region that is devoid of pathological changes and Lewy bodies; and two additional regions, the amygdala and anterior cingulate cortex which contain Lewy bodies at different disease stages but do not have as severe degeneration as the substantia nigra.

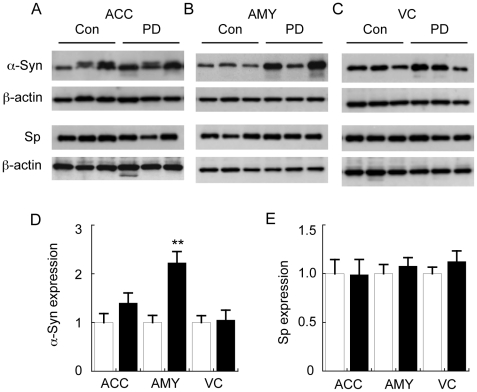
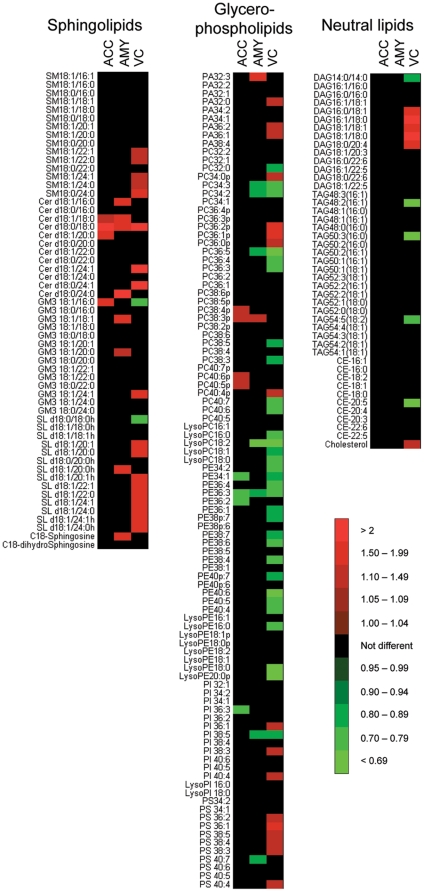
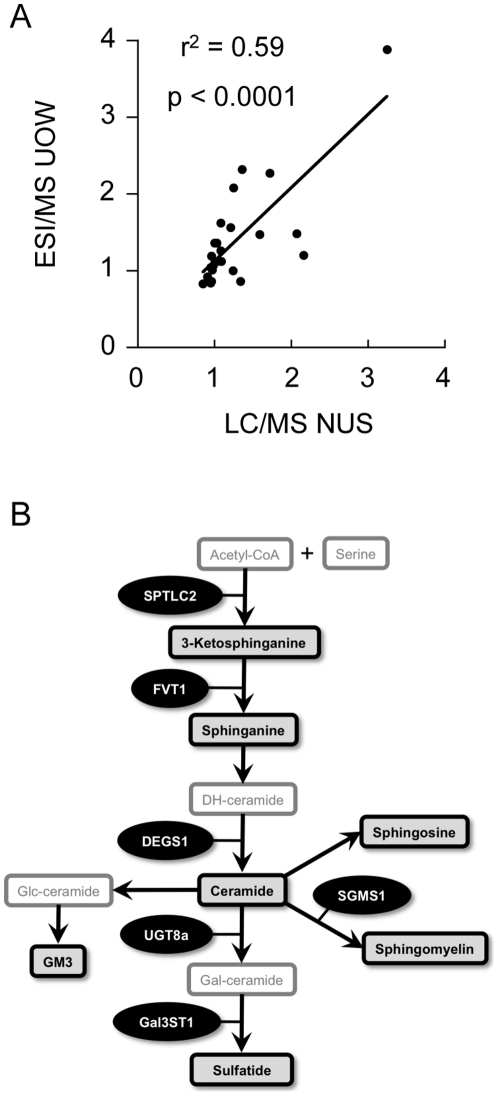
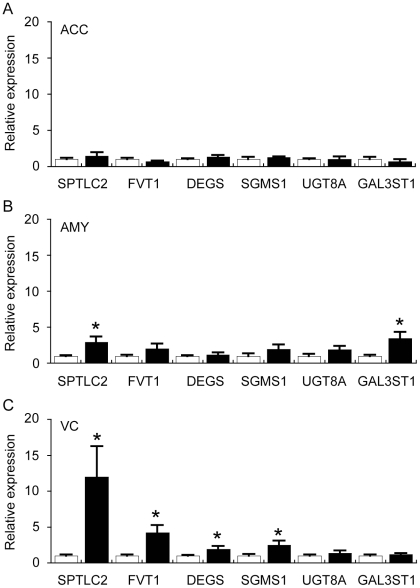
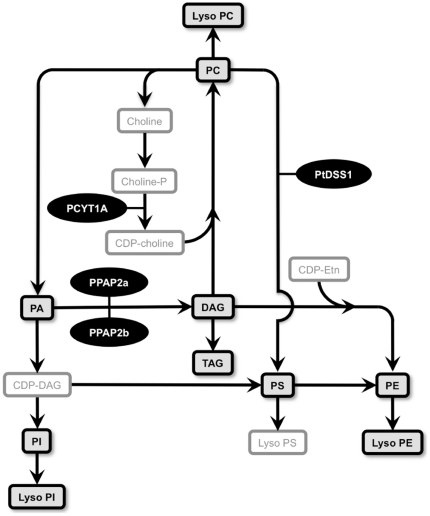
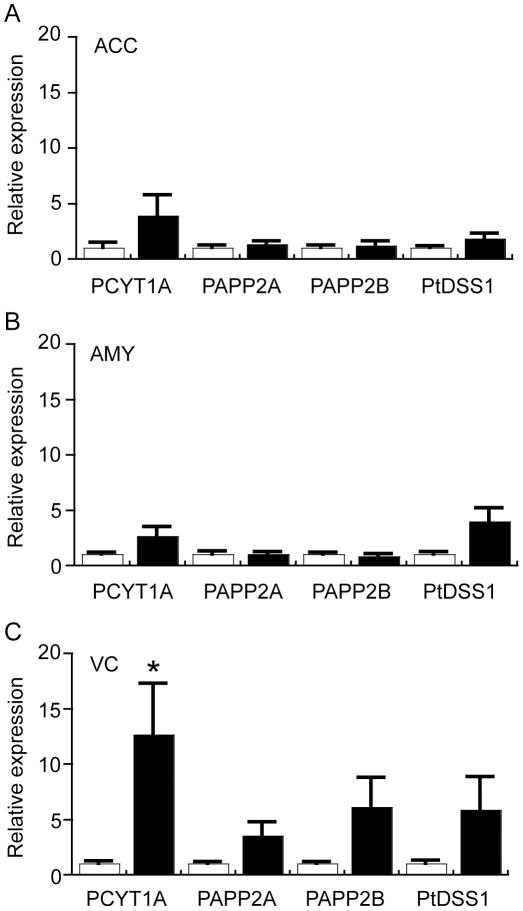
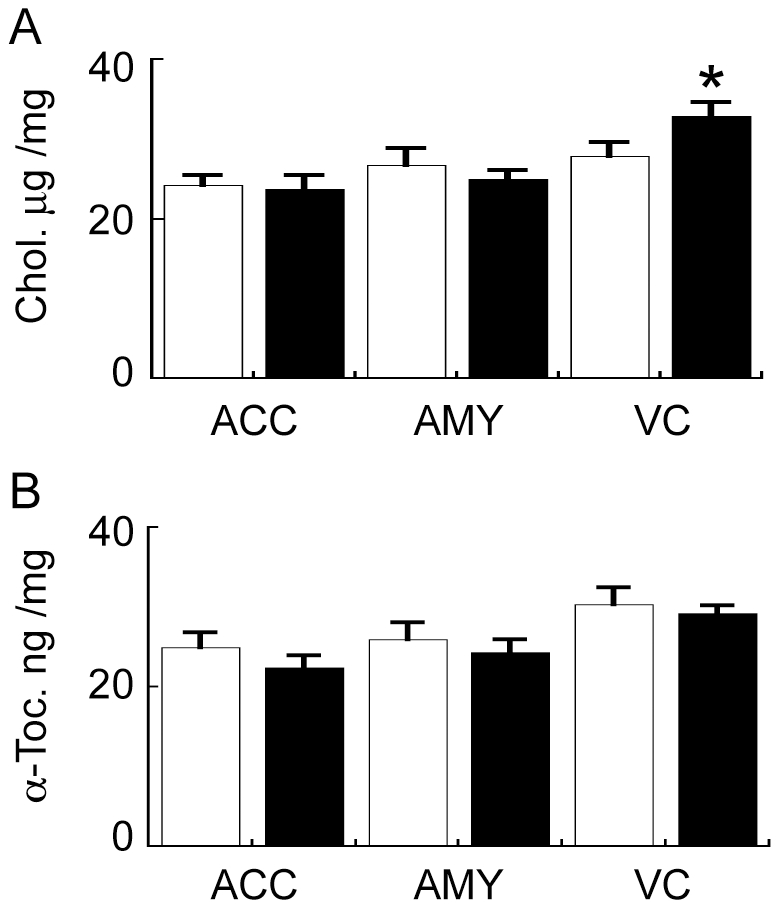
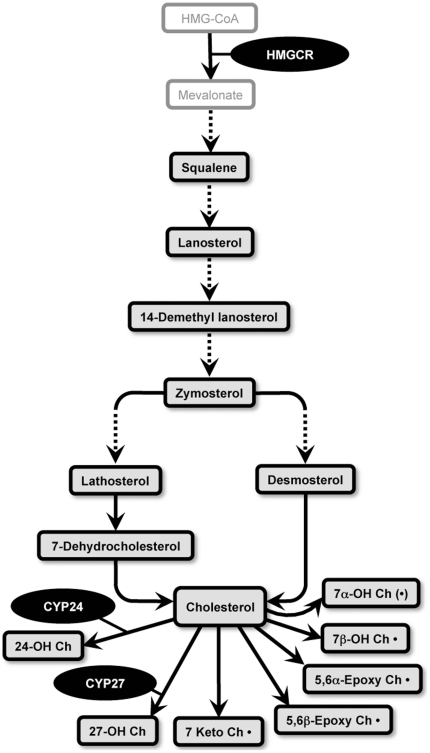
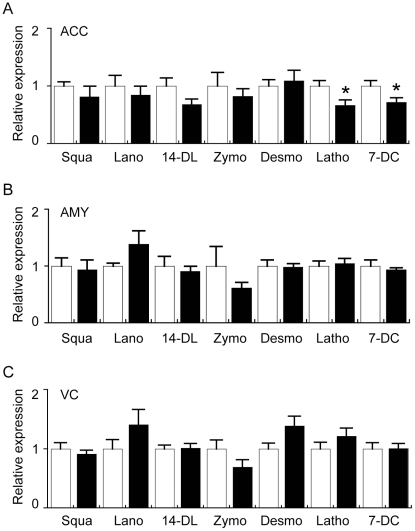
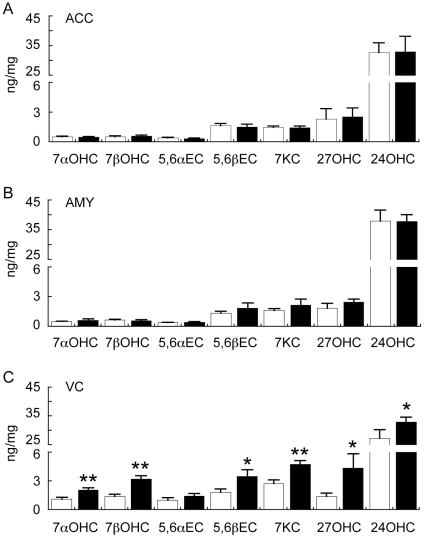
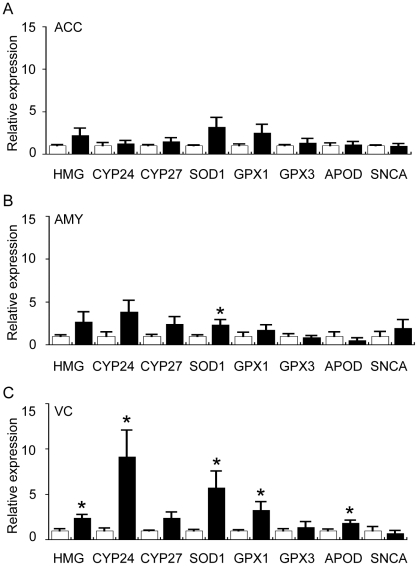
Methodology/principal findings: Using liquid chromatography mass spectrometry lipidomics techniques for an initial screen of 200 lipid species, significant changes in 79 sphingolipid, glycerophospholipid and cholesterol species were detected in the visual cortex of Parkinson's disease patients (n = 10) compared to controls (n = 10) as assessed by two-sided unpaired t-test (p-value <0.05). False discovery rate analysis confirmed that 73 of these 79 lipid species were significantly changed in the visual cortex (q-value <0.05). By contrast, changes in 17 and 12 lipid species were identified in the Parkinson's disease amygdala and anterior cingulate cortex, respectively, compared to controls; none of which remained significant after false discovery rate analysis. Using gas chromatography mass spectrometry techniques, 6 out of 7 oxysterols analysed from both non-enzymatic and enzymatic pathways were also selectively increased in the Parkinson's disease visual cortex. Many of these changes in visual cortex lipids were correlated with relevant changes in the expression of genes involved in lipid metabolism and an oxidative stress response as determined by quantitative polymerase chain reaction techniques.

Conclusions/significance: The data indicate that changes in lipid metabolism occur in the Parkinson's disease visual cortex in the absence of obvious pathology. This suggests that normalization of lipid metabolism and/or oxidative stress status in the visual cortex may represent a novel route for treatment of non-motor symptoms, such as visual hallucinations, that are experienced by a majority of Parkinson's disease patients.


Conflict of interest statement

Competing Interests: The authors have declared that no competing interests exist.

Figures

Figure 1
Figure 1. Analysis of α-synuclein and synaptophysin in fractionated Parkinson's disease tissues.
Tissues were homogenised into three fractions that contained tris-buffered saline (TBS), TBS containing Triton X100 (TX) or sodium dodecyl sulphate (SDS) and α-synuclein (α-Syn), synaptophysin (Sp) and β-actin expression was analysed by Western blotting (A). The intensity of the bands was measured and the relative amounts of α-Syn and Sp in each fraction is expressed in the histogram (B). The data are derived from Parkinson's disease amygdala (PD AMY) samples and are used as an example to illustrate the techniques used to characterise the PD tissues. Data in “B” represent mean values with SEM shown by the error bars for the three samples shown in “A”.
Figure 2
Figure 2. Analysis of control (Con) and Parkinson's disease (PD) α-synuclein (α-Syn) and synaptophysin (Sp) levels.
Tissues were homogenised and fractionated as described in the legend to Figure 1 and insoluble α-Syn in the SDS fraction, and Sp in the TX-fraction was measured in the anterior cingulate cortex (ACC) (A), amygdala (AMY) (B), and visual cortex (VC) (C). Corresponding quantification of relative α-Syn (D) and Sp (E) protein expression in the three brain regions is provided in the histograms. Data represent mean ± SEM (n = 10), **p<0.001 by t-test.
Figure 3
Figure 3. Heat map illustrating significant changes in lipid levels associated with Parkinson's disease as assessed using a lipidomics approach.
Control (n = 10) and PD (n = 10) tissues were collected from the anterior cingulate cortex (ACC), amygdala (AMY) and visual cortex (VC). Lipids were extracted and analysed using an LC/MS lipidomics approach. The data indicates the fold change in the levels of sphingolipids, glycerophospholipids and neutral lipids detected in the PD samples relative to the Con samples. The intensity of the red and green colour represents the magnitude of increase or decrease, respectively, as indicated by the scale bar. Only statistically significant changes (p<0.05, t-test) are represented by the red and green colours in the heat map. Note: the nomenclature for phospholipid acyl chain length and saturation is abbreviated to improve clarity. The data used to generate the heat map is included as Tables S2 to S4.
Figure 4
Figure 4. Comparison of liquid chromatography-mass spectrometry (LC/MS; National university of Singapore, NUS) and electrospray ionisation mass spectrometry (ESI/MS; University of Wollongong, UOW) techniques for the detection of sphingolipid changes in control (Con) and Parkinson's disease (PD) tissues.
Independent aliquots of Con (n = 10) and PD (n = 10) tissues were collected from the anterior cingulate cortex, amygdala and visual cortex. Lipids were extracted and analysed using LC/MS lipidomics at NUS (LC/MS NUS) and ESI/MS at UOW (ESI/MS UOW). The fold-change in lipid levels of the PD samples relative to the controls is provided in the scatter plot that compares the data from the two laboratories (A). A simplified schematic diagram of relevant sphingolipids and related genes assessed in this study is provided (B). The lipids in the boxes with black borders were analysed in the present study. Serine palmitoyltransferase, long chain base subunit 2 (SPTLC2); follicular lymphoma variant translocation 1 (FVT1); degenerative spermatocyte homolog 1; lipid desaturase (DEGS1); sphingomyelin synthase 1 (SGMS1); UDP galactosyltransferase 8A (UGT8A); and galactose-3-O-sulfotransferase 1 (GAL3ST1). Pearson correlation analysis indicates a positive correlation between the independent analyses (p<0.0001).
Figure 5
Figure 5. Quantitative real-time PCR analysis of selected sphingolipid-related genes in the anterior cingulate cortex (ACC), amygdala (AMY) and visual cortex (VC) of control (Con) and Parkinson's disease (PD) tissues.
The expression of genes involved in the sphingolipid biosynthetic pathway (see Fig. 4B) was assessed by qRT-PCR. Data for all genes are expressed relative to the control values (Con  =  white bars, assigned a value of 1.0; PD  =  black bars). The data are presented separately for ACC (A), AMY (B) and VC (C). Serine palmitoyltransferase, long chain base subunit 2 (SPTLC2); follicular lymphoma variant translocation 1 (FVT1); degenerative spermatocyte homolog 1, lipid desaturase (DEGS); sphingomyelin synthase 1 (SGMS1); UDP galactosyltransferase 8A (UGT8A); and galactose-3-O-sulfotransferase 1 (GAL3ST1). Data represent mean ± SEM, *p<0.05 by t-test.
Figure 6
Figure 6. Simplified scheme of relevant glycerophospholipids and related genes assessed in this study.
A simplified schematic diagram of relevant glycerophospholipids and related genes assessed in this study. The lipids in the boxes with black borders were analysed in the present study. Phosphatidylcholine (PC); phosphatidic acid (PA); phosphatidylinositol PI; phosphatidylserine PS; phosphatidylethanolamine (PE); diacylglycerol (DAG); cytidine diphosphate-diacylglycerol (CDP-DAG); cytidinediphosphate-choline (CDP-Choline); cytidinediphosphate-ethanolamine (CDP-Etn); phosphocholine cytidylytransferase 1a (PCYT1A); phosphatidic acid phosphatase 2a (PPAP2A); phosphatidic acid phosphatase 2B (PPAP2B); phosphatidylserine synthase I (PtDSS1).
Figure 7
Figure 7. Quantitative real-time PCR analysis of selected glycerophospholipid-related genes in the anterior cingulate cortex (ACC), amygdala (AMY) and visual cortex (VC) of control (Con) and Parkinson's disease (PD) tissues.
The expression of genes involved in the glycerophospholipid biosynthetic pathway (see Fig. 6) was assessed by qRT-PCR. Data for all genes are expressed relative to the control values (Con  =  white bars, assigned a value of 1.0; PD  =  black bars). The data are presented separately for ACC (A), AMY (B) and VC (C). Phosphocholine cytidylytransferase 1a (PCYT1A); Phosphatidic acid phosphatase 2a (PPAP2A); phosphatidic acid phosphatase 2B (PPAP2B); Phosphatidylserine synthase I (PtDSS1). Data represent mean ± SEM, *p<0.05 by t-test.
Figure 8
Figure 8. High performance liquid chromatography (HPLC) analysis of cholesterol and α-tocopherol in the anterior cingulate cortex (ACC), amygdala (AMY) and visual cortex (VC) of control (Con) and Parkinson's disease (PD) tissues.
Cholesterol (A) and α-tocopherol (B) levels were analysed in the ACC, AMY and VC of Con (white bars) and PD (black bars) tissues by reversed phase HPLC. Data represent mean ± SEM, *p<0.05 by t-test.
Figure 9
Figure 9. Simplified schematic diagram of cholesterol synthesis, cholesterol metabolites and selected relevant genes analysed in this study.
The lipids in the boxes with black borders were analysed in the present study. The broken lines indicated additional intermediates are present in the pathway but they are not not shown in the scheme. The oxysterols that are followed by a dot “•” are formed by non-enzymatic oxidative reactions. The symbol “(•)” indicates the oxysterol is formed via both enzymatic and non-enzymatic routes. 24-hydroxycholesterol (24-OH Ch); 27-hydroxycholesterol (27-OH Ch); 7keto-cholesterol (7keto Ch); cholesterol-5α,6α-epoxide (5,6α-Epoxy Ch); cholesterol-5β,6β-epoxide (5,6β-Epoxy Ch); 7α-hydroxycholesterol (7α-OH Ch); 7β-hydroxycholesterol (7β-OH Ch); 3-hydroxy-3-methylglutaryl-CoA reductase (HMGCR); cytochrome P450, family 24, subfamily A, polypeptide 1 (CYP24); cytochrome P450, family 27, subfamily A, polypeptide 1 (CYP27).
Figure 10
Figure 10. Gas chromatography mass spectrometry (GC/MS) analysis of cholesterol precursors in the anterior cingulate cortex (ACC), amygdala (AMY) and visual cortex (VC) of control (Con) and Parkinson's disease (PD) tissues.
Control (n = 10) and PD (n = 10) tissues were collected from the ACC (A), AMY (B) and VC (C). Lipids were extracted and cholesterol precursors analysed using GC/MS. The data indicates the fold change in the levels of cholesterol precursors detected in the PD (black bars) samples relative to the Con (white bars) samples. Absolute values for the cholesterol precursors in the different brain regions are provided as Table S8. Squalene (Squa); lanosterol (Lano), 14-dimethyl lanosterol (14-DL), zymosterol (Zymo), desmosterol (Desmo), lathosterol (Latho), 7-dehyrocholesterol (7-DC). Data represent mean ± SEM.
Figure 11
Figure 11. Gas chromatography mass spectrometry (GC/MS) analysis of oxysterols in the anterior cingulate cortex (ACC), amygdala (AMY) and visual cortex (VC) of control (Con) and Parkinson's disease (PD) tissues.
Control (n = 10) and PD (n = 10) tissues were collected from the ACC (A), AMY (B) and VC (C). Lipids were extracted and oxysterols analysed using GC/MS. The data indicates the fold change in the levels of oxysterols detected in the PD (black bars) samples relative to the Con (white bars) samples. 7α-hydroxycholesterol (7αOHC); 7β-hydroxycholesterol (7βOHC); cholesterol-5α,6α-epoxide (5,6αEC); cholesterol-5β,6β-epoxide (5,6βEC); 7keto-cholesterol (7KC); 27-hydroxycholesterol (27OHC); 24-hydroxycholesterol (24OHC). Data represent mean ± SEM, *p<0.05, **p<0.001 by t-test.
Figure 12
Figure 12. Quantitative real-time PCR analysis of selected sterol-related and oxidative stress-related genes in the anterior cingulate cortex (ACC), amygdala (AMY) and visual cortex (VC) of control (Con) and Parkinson's disease (PD) tissues.
The expression of genes involved in cholesterol metabolism and oxidative stress was assessed by qRT-PCR. Data for all genes are expressed relative to the control values (Con  =  white bars, assigned a value of 1.0; PD  =  black bars). The data are presented separately for ACC (A), AMY (B) and VC (C). 3-hydroxy-3-methyl-glutaryl-CoA reductase (HMG); cytochrome P450, family 24, subfamily A, polypeptide 1 (CYP24); cytochrome P450, family 27, subfamily A, polypeptide 1 (CYP27); superoxide dismutase 1 (SOD1); glutathione peroxidase 1 (GPX1); glutathione peroxidase 3 (GPX3); Apolipoprotein-D (APOD); α-synuclein (SNCA). Data represent mean ± SEM, *p<0.05 by t-test.

References

    1. Fahn S. Description of Parkinson's disease as a clinical syndrome. Ann N Y Acad Sci. 2003;991:1–14. - PubMed
    1. Obeso JA, Rodriguez-Oroz MC, Goetz CG, Marin C, Kordower JH, et al. Missing pieces in the Parkinson's disease puzzle. Nat Med. 2010;16:653–661. - PubMed
    1. Dickson DW, Braak H, Duda JE, Duyckaerts C, Gasser T, et al. Neuropathological assessment of Parkinson's disease: refining the diagnostic criteria. Lancet Neurol. 2009;8:1150–1157. - PubMed
    1. Gai WP, Yuan HX, Li XQ, Power JT, Blumbergs PC, et al. In situ and in vitro study of colocalization and segregation of alpha-synuclein, ubiquitin, and lipids in Lewy bodies. Exp Neurol. 2000;166:324–333. - PubMed
    1. Halliday GM, Ophof A, Broe M, Jensen PH, Kettle E, et al. Alpha-synuclein redistributes to neuromelanin lipid in the substantia nigra early in Parkinson's disease. Brain. 2005;128:2654–2664. - PubMed

Publication types

MeSH terms