. 2012 Feb;34(1):75-85.
doi: 10.1007/s11357-011-9221-9. Epub 2011 Mar 9.

Autophagic activity in thymus and liver during aging

Affiliations

Autophagic activity in thymus and liver during aging

Mohammad Nizam Uddin et al. Age (Dordr). 2012 Feb.

Abstract

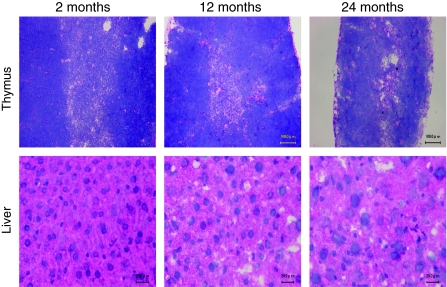
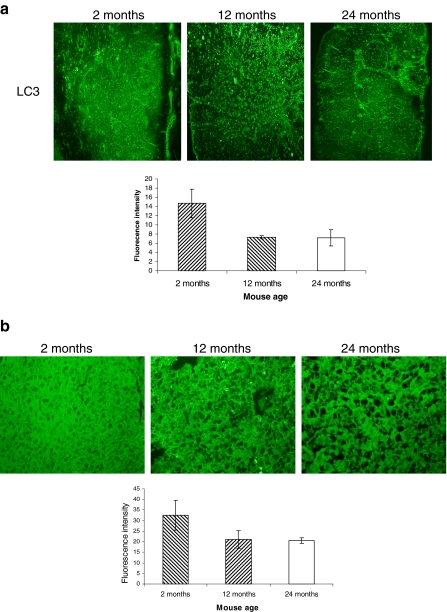
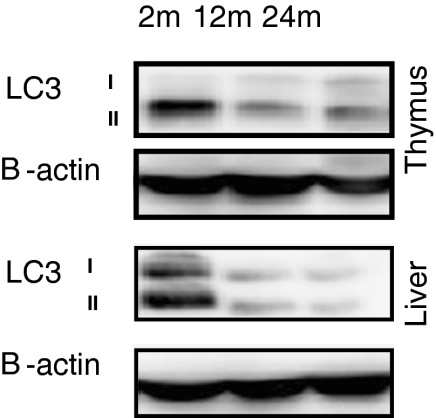
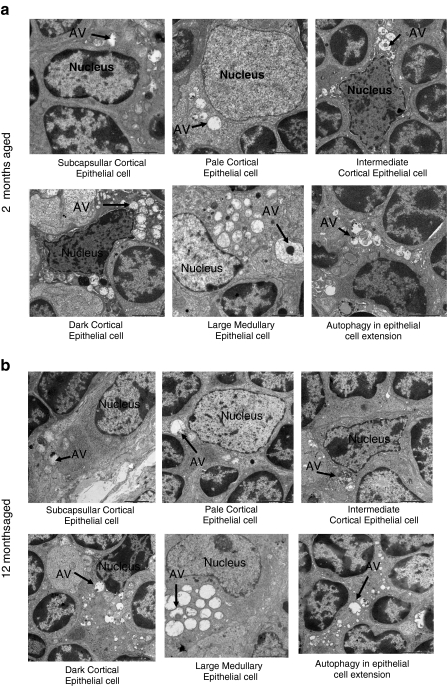
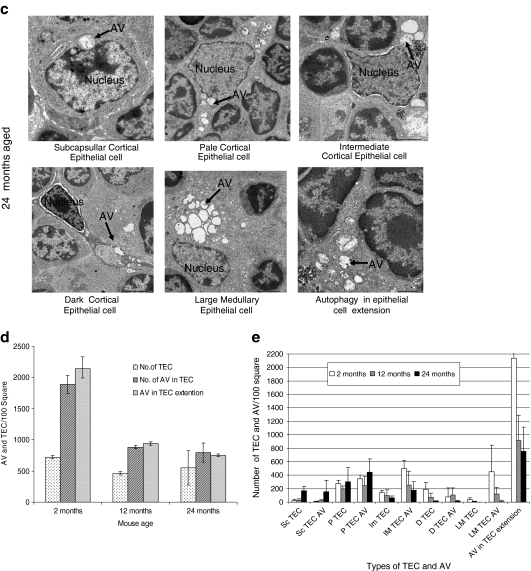
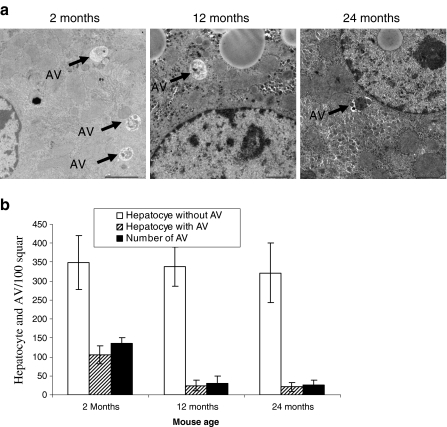
Impaired or deficient autophagy is believed to cause or contribute to aging, as well as several age-related pathologies. Thymic epithelial cells had a high constitutive level of autophagy. The autophagic process may play a supporting role or even a crucial role in the presentation of self-Ags in the thymus to shape the T-cell repertoires. Autophagic activity in the liver is important for the balance of energy and nutrients for basic cell functions. The abundance of autophagic structure in both cortical and medullary thymic epithelial cells and liver with mouse age has not been examined in detail. Here, we demonstrated that the architecture of mouse thymus and liver markedly changed with age. We found that the expression of LC3 detected by immunofluorescence and Western blot analysis was greatly decreased in thymus and liver of 12-month-old mice. The same level of reduction was observed in thymus and liver of 24-month-old mice. Ultrastructure analysis by an electron microscope revealed that the number of autophagic structure/vacuole in total thymic epithelial cells and hepatocytes decrease with age. The age-related decrease of autophagic structure in thymic epithelial cells may cause the reduction of immunocompetent T-cell pool in aged mice. The age-related decrease of autophagy in liver may induce accumulation of cellular materials in liver of aged mice.


Figures

Fig. 1
Fig. 1
Structural and architectural changes occurred by aging. Frozen sections (10 μm) of thymus (upper panel) and liver (lower panel) tissues from 2-, 12-, and 24-month-old C57BL/6J ♀ mice were made. Cryosections were stained with hematoxylin–eosin (H & E). The bar indicates 20 μM in the liver and 100 μM in the thymus. This figure shows the representative results from three independent experiments
Fig. 2
Fig. 2
Basal autophagosome in the thymus and liver decreases with aging. a Frozen sections (10 μm) of the thymus (a) and liver (b) from 2-, 12-, and 24-month-old C57BL/6J ♀ mice were made. The sections were stained with rabbit anti-LC3 and immunoreactivity was detected with AF488-conjugated goat anti-rabbit IgG. The slides were then viewed and relative fluorescence was measured with BZ-8000 fluorescence microscopy. This figure shows the representative results from three independent experiments. Error bars represent standard deviation (SD). Statistical significance was determined by Student’s t test
Fig. 3
Fig. 3
LC3 expression in the thymus and liver at different stages of mouse age. Thymus and liver tissues from 2-, 12-, and 24-month-old C57BL/6J ♀ mice were prepared for Western blot analysis. LC3 expression was measured by anti-LC3. As an internal control, β-actin was used. This figure shows the representative results from three independent experiments
Fig. 4
Fig. 4
Ultrastructure analysis for thymic epithelial cells for autophagy. Electron micrograph (×2,500) of thymus tissues from a 2-, b 12-, and c 24-month-old C57BL/6J ♀ mice. Seventy-nanometer ultrathin sections were stained with uranyl acetate and lead stain solution. They were observed under the transmission electron microscope and photographed at ×2,500. Arrow marks indicate the autophagic structure in thymic epithelial cells. d The number of autophagic structure in thymic epithelial cells were enumerated under the electron microscope and presented as the number of thymic epithelial cells and autophagic structure per 100 squares in the copper grid. This figure shows the representative results from three independent experiments. e The number of autophagic structure in subcapsullar thymic epithelial cell (Sc TEC), pale thymic epithelial cell (P TEC), intermediate thymic epithelial cell (Im TEC), dark thymic epithelial cell (D TEC), large medullary thymic epithelial cell (LM TEC), and in epithelial cell extension was enumerated under the electron microscope and presented as the number of thymic epithelial cells and autophagic vacuole (AV) per 100 squares in the copper grid. This figure shows the representative results from three independent experiments
Fig. 4
Fig. 4
Ultrastructure analysis for thymic epithelial cells for autophagy. Electron micrograph (×2,500) of thymus tissues from a 2-, b 12-, and c 24-month-old C57BL/6J ♀ mice. Seventy-nanometer ultrathin sections were stained with uranyl acetate and lead stain solution. They were observed under the transmission electron microscope and photographed at ×2,500. Arrow marks indicate the autophagic structure in thymic epithelial cells. d The number of autophagic structure in thymic epithelial cells were enumerated under the electron microscope and presented as the number of thymic epithelial cells and autophagic structure per 100 squares in the copper grid. This figure shows the representative results from three independent experiments. e The number of autophagic structure in subcapsullar thymic epithelial cell (Sc TEC), pale thymic epithelial cell (P TEC), intermediate thymic epithelial cell (Im TEC), dark thymic epithelial cell (D TEC), large medullary thymic epithelial cell (LM TEC), and in epithelial cell extension was enumerated under the electron microscope and presented as the number of thymic epithelial cells and autophagic vacuole (AV) per 100 squares in the copper grid. This figure shows the representative results from three independent experiments
Fig. 5
Fig. 5
Ultrastructure analysis of liver cells for autophagic structure. a Electron micrograph (×2,500) of liver tissues from 2-, 12-, and 24-month-old C57BL/6J ♀ mice. Seventy-nanometer ultrathin sections were stained with uranyl acetate and lead stain solution. They were observed under the transmission electron microscope and photographed at ×2,500. Arrow marks indicate the autophagy in liver cells. b The number of autophagic structure in liver cells was enumerated under the electron microscope and presented as the number of liver cells and autophagic structure per 100 squares in the copper grid. This figure shows the representative results from three independent experiments. Error bars represent standard deviation (SD). Statistical significance was determined by Student’s t test

References

    1. Bishop NA, Guarente L. Genetic links between diet and lifespan: shared mechanisms from yeast to humans. Nat Rev Genet. 2007;8:835–844. doi: 10.1038/nrg2188. - DOI - PubMed
    1. Cuervo AM, Bergamini E, Brunk UT, Droge W, Ffrench M, Terman A. Autophagy and aging: the importance of maintaining “clean” cells. Autophagy. 2005;1(3):131–140. doi: 10.4161/auto.1.3.2017. - DOI - PubMed
    1. Deter RL, Duve C. Influence of glucagon, an inducer of cellular autophagy, on some physical properties of rat liver lysosomes. J Cell Biol. 1967;33:437–449. doi: 10.1083/jcb.33.2.437. - DOI - PMC - PubMed
    1. Goldberg AL. Protein degradation and protection against misfolded or damaged proteins. Nature. 2003;426:895–899. doi: 10.1038/nature02263. - DOI - PubMed
    1. Guarente L, Kenyon C. Genetic pathways that regulate ageing in model organisms. Nature. 2000;408:255–262. doi: 10.1038/35041700. - DOI - PubMed

Publication types

LinkOut - more resources