. 2011 Apr 30;32(6):1183-94.
doi: 10.1002/jcc.21688. Epub 2010 Nov 29.

Wordom: a user-friendly program for the analysis of molecular structures, trajectories, and free energy surfaces

Affiliations
Free PMC article

Wordom: a user-friendly program for the analysis of molecular structures, trajectories, and free energy surfaces

Michele Seeber et al. J Comput Chem. .
Free PMC article

Abstract

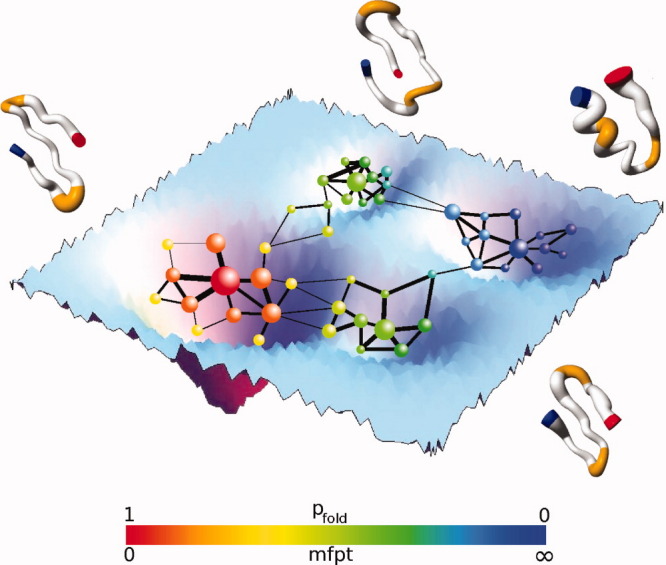
Wordom is a versatile, user-friendly, and efficient program for manipulation and analysis of molecular structures and dynamics. The following new analysis modules have been added since the publication of the original Wordom paper in 2007: assignment of secondary structure, calculation of solvent accessible surfaces, elastic network model, motion cross correlations, protein structure network, shortest intra-molecular and inter-molecular communication paths, kinetic grouping analysis, and calculation of mincut-based free energy profiles. In addition, an interface with the Python scripting language has been built and the overall performance and user accessibility enhanced. The source code of Wordom (in the C programming language) as well as documentation for usage and further development are available as an open source package under the GNU General Purpose License from http://wordom.sf.net.


Figures

Figure 1
Figure 1
Application of the SPM (within the ENM module) to the GTP-bound Gαi1-subunit (PDB: 1CIP). Each Cα-atom is colored according to the response to the perturbation of the 1st normal mode. Coloring from red to blue indicates maximum (100%) and minimum (0%) perturbations, respectively. Arrows point in the direction of the 1st normal mode. [Color figure can be viewed in the online issue, which is available at wileyonlinelibrary.com.]
Figure 2
Figure 2
Cross-correlation matrix of the atomic fluctuations of the Gαi1-subunit Cα-atoms and the geometrical center of GTP. The regions below and above the matrix main diagonal concern the DCC and LMI correlation methods, respectively. DCC correlation values go from −1.0 (fully anti-correlated motions) to 1.0 (fully correlated motions), whereas LMI correlation values go from 0.0 (fully uncorrelated motions) to 1.0 (full correlated motions).
Figure 3
Figure 3
Hub correlation analysis on a 10 ns MD trajectory of GTP-bound Gαi1-subunit. Each dot corresponds to two amino acids that show a correlated tendency to behave as hubs (i.e., that are syncronized in their hub behavior in more than 50% of the trajectory frames). An Imin = 3.0% was employed for the PSN analysis.
Figure 4
Figure 4
Results of PSN and PATH analyses on a 10 ns MD trajectory of GTP-bound Gαi1-subunit. (A) Cα-atoms of the 27 stable hub residues, at Imin = 3.0%, are represented as cyan spheres. The GTP molecule, which is a stable hub as well, is shown as a red sphere centered on the C4 ribose atom. Nodes are considered as stable hubs if they are involved in at least four connectivities at a given Imin (3.0% in this case) in more than 50% of the trajectory frames. (B) The 90 nodes that contribute to the largest cluster at Imin = 3.0% are shown as green spheres centered on the Cα-atoms. The GTP molecule, which participates as well in such cluster, is shown as a red sphere centered on the C4 ribose atom. (C) Representation of the most frequent shortest communication path (i.e., frequency = 46%). The amino acids that participate in the path are shown as magenta spheres centered on the Cα-atoms, whereas GTP, which participates in the path as well, is shown as a red sphere centered on the C4′ ribose atom. The two apical residues in this path are A152 and I222, located, respectively, in the α-helical and Ras-like domains.
Figure 5
Figure 5
Complex network analysis of free energy landscapes. (A) Conformation space network. Nodes and links are protein conformations (i.e., microstates, see main text) and direct transitions sampled during the MD simulation, respectively. Node size is proportional to the population of the microstate, whereas link width is proportional to the transitions frequencies, i.e., larger link widths indicate more frequent transitions. Densely connected regions of the network represent rapidly interconverting microstates that belong to the same free energy basin (highlighted by a shaded circle). (B) Simplified example of a two state system. The free energy barrier between the two macro-states is represented by a region of minimum flow in the network (identified by a minimum-cut). (C) Cut-based free energy profile (cFEP). The free energy is projected onto the partition function-based reaction coordinate Z, a projection that preserves the barriers as it takes into account all possible pathways to a reference microstate. The solid vertical line indicates the correspondence between the minimum-cut and the highest free energy barrier.
Figure 6
Figure 6
Network description of MD and evaluation of kinetic distance. The high-dimensional free-energy surface is coarse-grained into nodes of a network. The figure shows a schematic illustration of the transition network of a β-sheet peptide where nodes represent microstates and links represent direct transitions sampled along the MD simulation(s). The size of the nodes and links is proportional to the statistical weight of the microstates and number of transitions, respectively. The cFEP method implemented in Wordom requires a reference microstate. In this simplified illustration, the reference microstate is the large red sphere in the center of the folded state (which is the β-sheet structure, i.e., the basin on the left). The kinetic distance of each node from the reference microstate can be evaluated in Wordom by the folding probability (pfold) or the mean first passage time (mfpt). The kinetic distance is rendered by the continuous coloring from red (folded, i.e., pfold = 1 or mfpt = 0) to blue (unfolded, i.e., pfold = 0 or mfpt = infinity).

Similar articles

Cited by

References

    1. Seeber M, Cecchini M, Rao F, Settanni G, Caflisch A. Bioinformatics. 2007;23:2625. - PubMed
    1. Brooks BR, Bruccoleri RE, Olafson BD, States DJ, Swaminathan S, Karplus M. J Comput Chem. 1983;4:187.
    1. Brooks BR, Brooks CL, III, Mackerell AD, Jr., Nilsson L, Petrella RJ, Roux B, Won Y, Archontis G, Bartels C, Boresch S, Caflisch A, Caves L, Cui Q, Dinner AR, Feig M, Fischer S, Gao J, Hodoscek M, Im W, Kuczera K, Lazaridis T, Ma J, Ovchinnikov V, Paci E, Pastor RW, Post CB, Pu JZ, Schaefer M, Tidor B, Venable RM, Woodcock HL, Wu X, Yang W, York DM, Karplus M. J Comput Chem. 2009;30:1545. - PMC - PubMed
    1. Lindahl E, Hess B, van der Spoel D. J Mol Model. 2001;7:306.
    1. Case D, Cheatham T, III, Darden T, Gohlke H, Luo R, Merz K, Jr., Onufriev A, Simmerling C, Wang B, Woods R. J Comput Chem. 2005;26:1668. - PMC - PubMed

Publication types

LinkOut - more resources